Data scraping with Data Miner as a browser extension: Analyze social media channels for post reactions over time


Data Miner is a browser extension that can scrape data from website interfaces. For trend analyzes in the social media area, likes, comments and texts can be extracted from posts in order to display the data in a timeline.
Data scraping is a simple but very effective approach to analyzing social media channels. Data from the surface of a website is collected with the scraper and then output in an Excel or CSV file. In the case of social media posts, this would be, for example, likes, comments, post text and the date of the post. This allows us to examine the performance of companies’ and competitors’ social media channels in a simple and relaxed manner and find out which accounts use particularly successful strategies and record the most interactions on the posts.
There is a big difference to the conventional social media analyzes that are available from the various software in this area: they do not work with scraping, but are API-based. In other words, they connect to the programming interface of the respective platform and call up the data for the examined social media account directly from there. This usually has two disadvantages: First, the platforms (Facebook, Instagram, Twitter) limit the query period for posts and accounts relatively severely, so that, depending on the price model, you can see a performance retrospectively 7 days or 28 days. And secondly, depending on the depth of the data, the tools cost more and more because API calls are subject to fees that the social media tool pays to the platforms. If you book a good package for a fee, you can perhaps analyze a competitor’s account for one year retrospectively for performance – an even longer period would cost even more money or not exist at all.
In-depth analysis and full independence via data scraping with data miners
Data Miner free as a browser extension »
Data scraping approaches for analyzing posts over time are much cheaper and in most cases free because we can operate and control them ourselves. In addition, trends can be measured in unlimited retrospective periods because data scrapers can simply go through each post to the very first post sent. In other words – they are not limited by a paid platform API, which in turn gives the user a high degree of independence.
With the browser extension Data Miner for Google Chrome, this is already possible in the free package. As of 2022, Data Miner is characterized by the fact that the application does not run via an installed program, but as an extension directly via the browser. At the same time, operation is much easier than in the scraping applications of recent years. However, the range of functions in the free package is also lower than, for example, with the web scraping tool Octoparse, which offers the possibility for complex and advanced scraping functions – such as clicking on elements, filling out contact forms, entering data and the automated execution of commands on different days. However, data miner is perfectly adequate for analyzing post reactions on LinkedIn, and it is very practical that beginners in particular are not overwhelmed with enormous complexity.
Data scraping applications always require our configuration from our side. In other words: We have to give the scraper a roadmap for website operation so that it can navigate through the website elements. The scraping works in real time and the application extracts the data post by post.
Typically, scrapers need three key inputs:
- Rows are the data content of the later Excel table and result from the fields of the website elements that we set for scraping
- Columns are the concrete data whose collection we set in the scraper and which should appear sorted in the columns of the later Excel spreadsheet
- Navigation is important when there is a need to perform indefinite scrolling motions or switch pages (pagination) to scrape the full range of social media posts. A loop function may be required so that the scraper runs again and again when it comes into contact with a navigation element until it finds no more navigation elements.
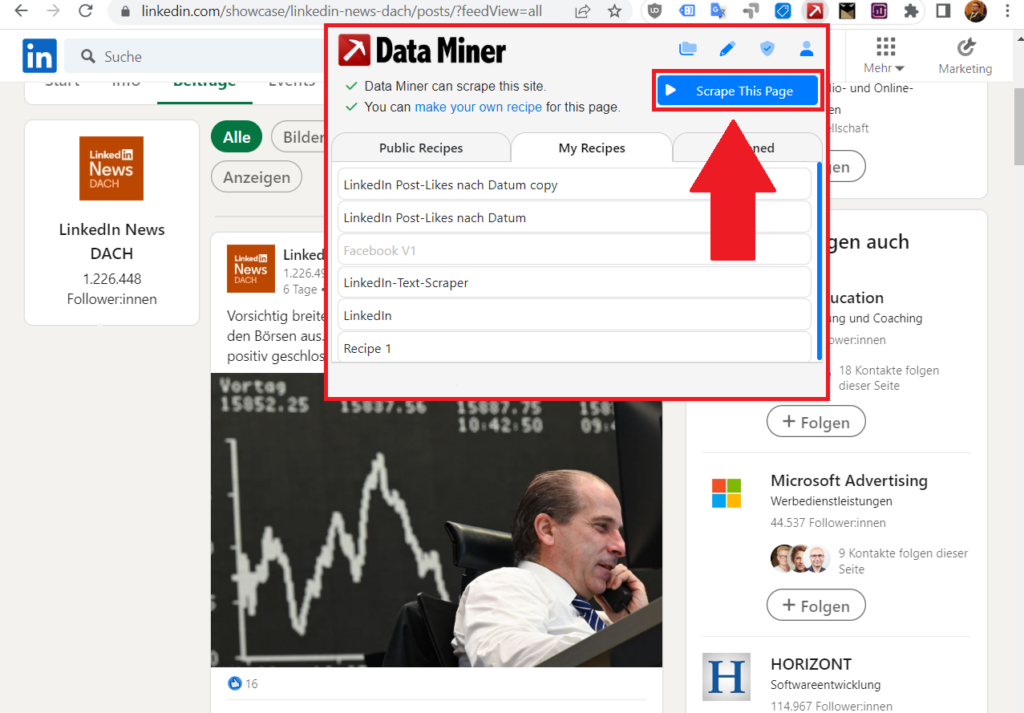
Step 1 – Install and launch Data Miner
Once you have installed Data Miner as a free browser extension in Google Chrome, you can go to a desired social media account and call up the extension. Then click on the blue Scrape This Page button.

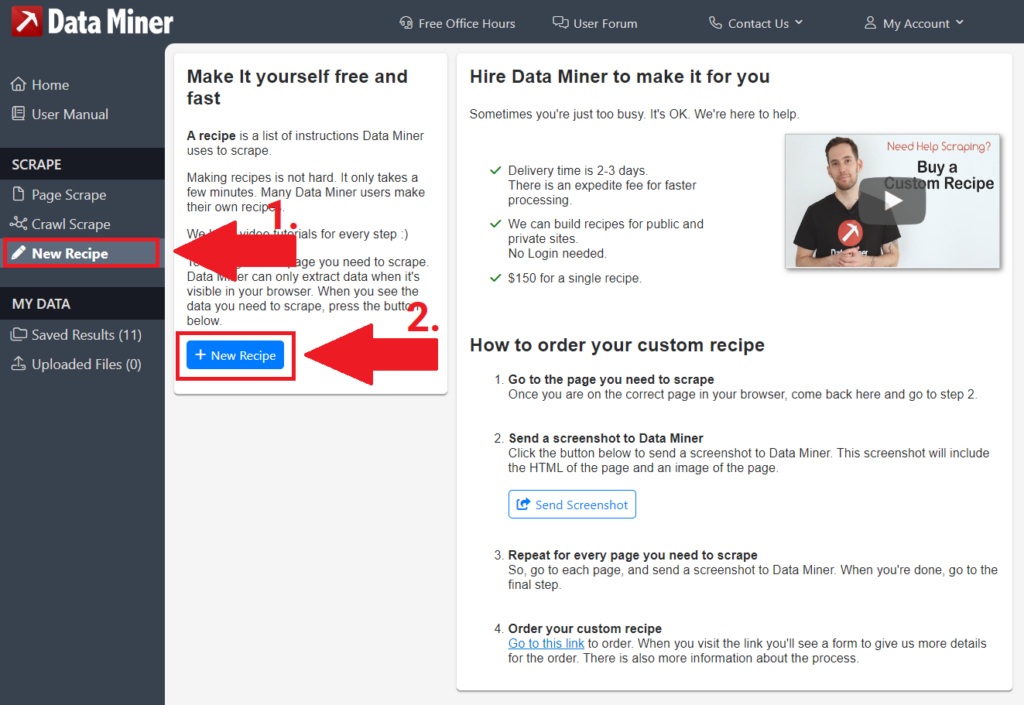
Click on New Recipe in the left menu bar and then on the blue button in the main window + New Recipe.

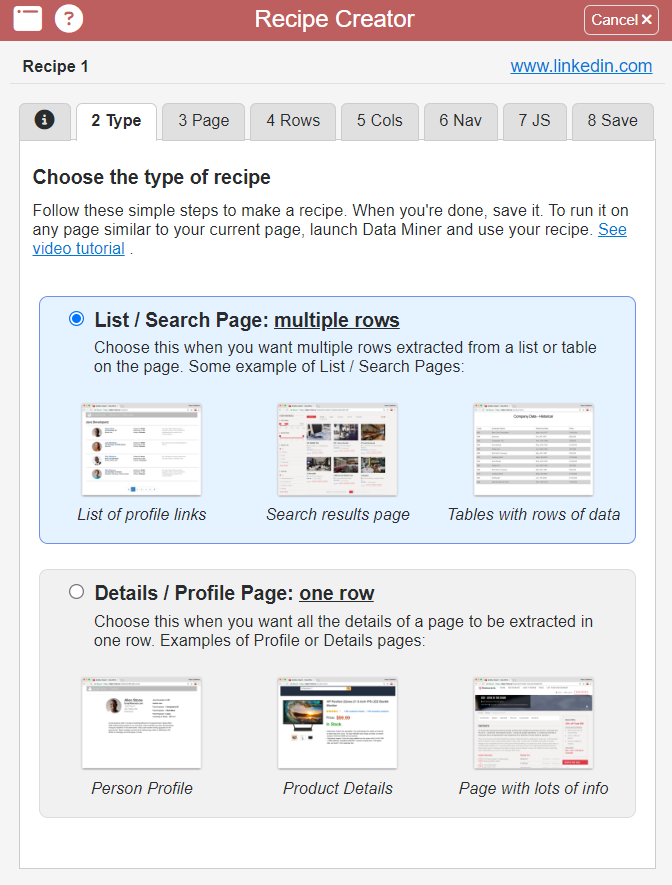
Step 2 – Multiple Rows by Data Miner
In the window that opens, go to the second tab at the top with the title Type. You don’t have to do anything else here, the default selection for “multiple rows” is already the right one for social media accounts.

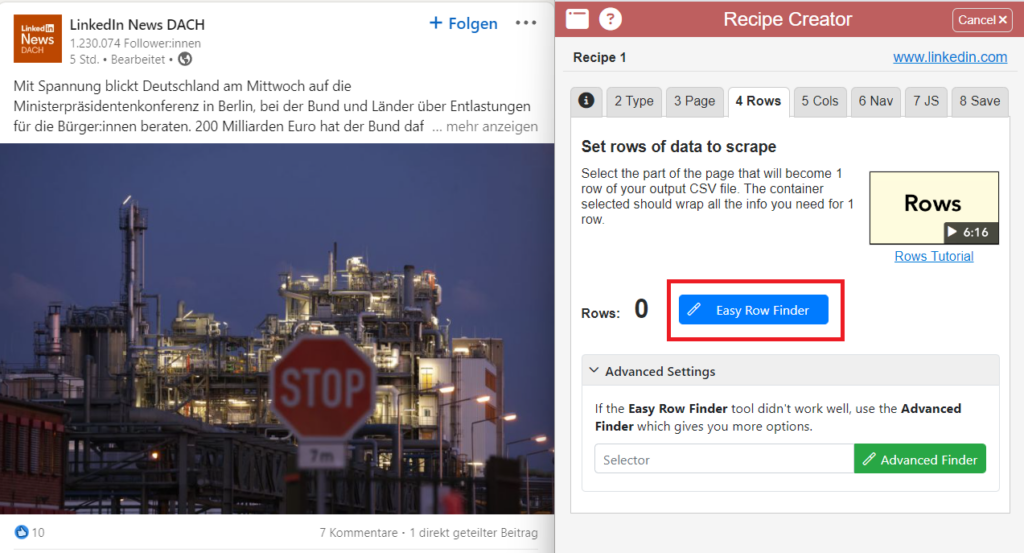
Step 3 – Page & Easy Row Finder by Data Miner
Now go to the third tab at the top titled Page and click on the Easy Row Finder button. This is now one of three crucial steps to give the scraper the timetable for operation.

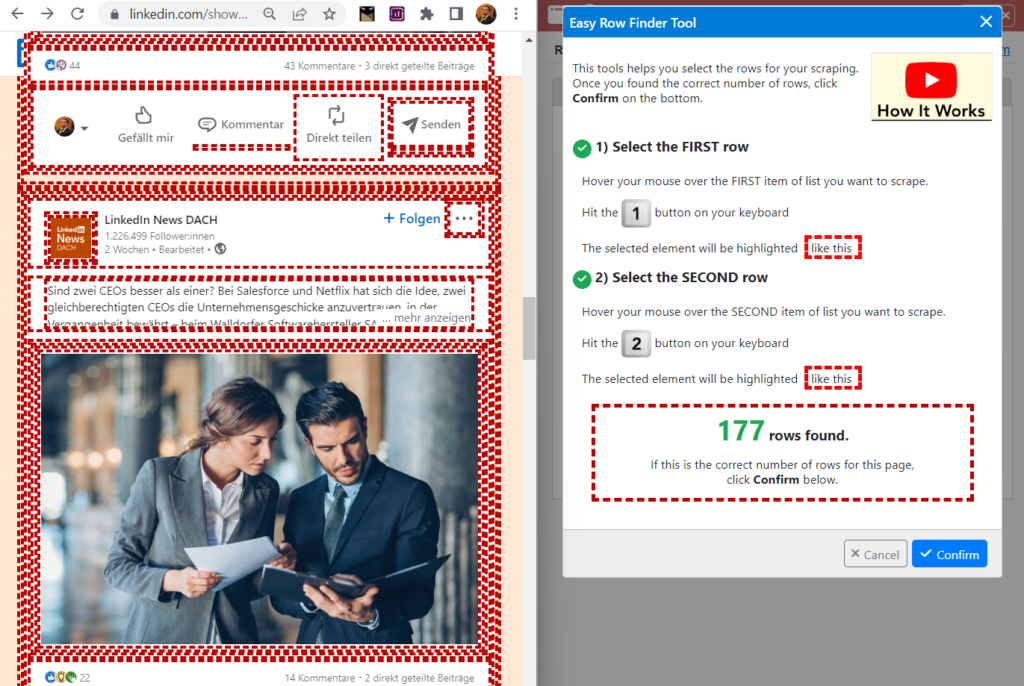
Now select an entire post with the mouse. Meanwhile, the selection of the surface is shown in red. Then press the number 1 to confirm the selection.
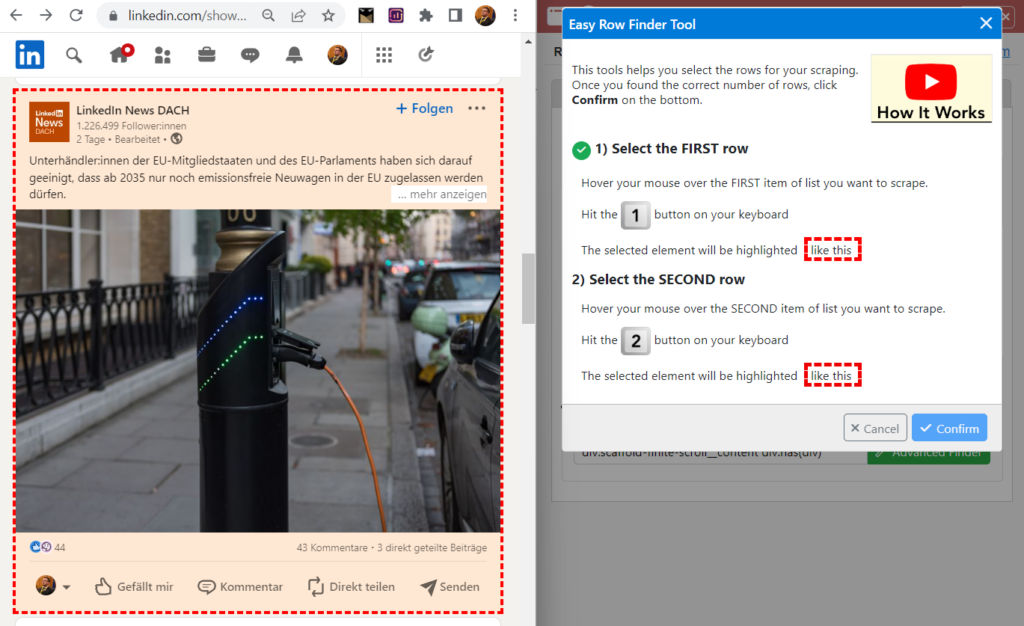

Now select another element on a second post with the mouse and press the number 2 to confirm the selection. This is to ensure that all posts are included in the selection for the rows.

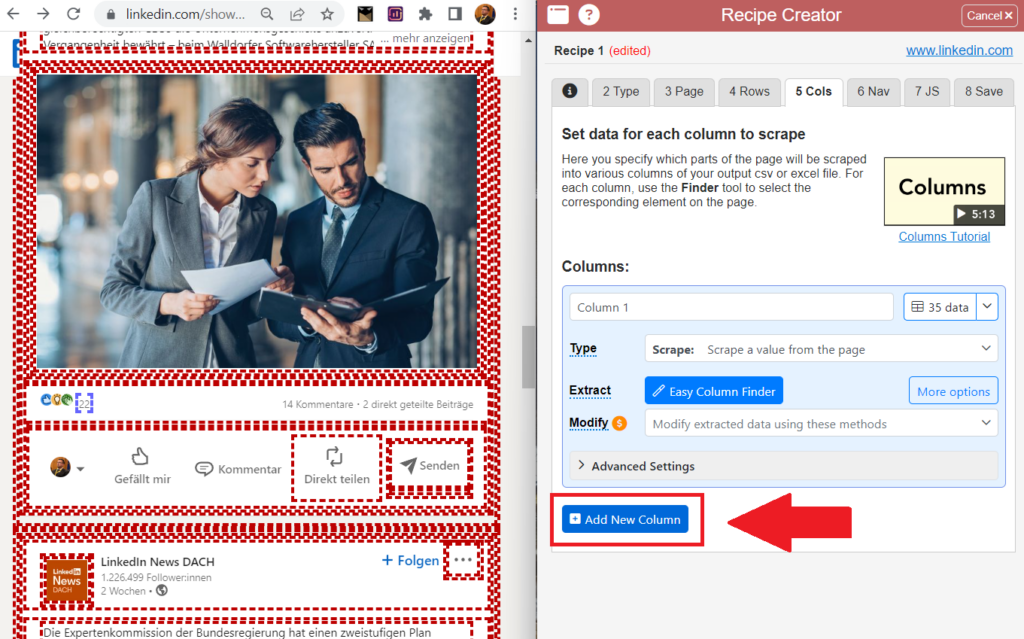
Step 4 – Columns & Easy Column Finder by Data Miner
Now we need to set Columns. These save the specific data to be extracted from the posts in the later Excel or CSV table. In this case, this would be: The number of post reactions and the dates of each post to understand performance over time. To do this, click on the 5 Cols tab at the top and create two columns.

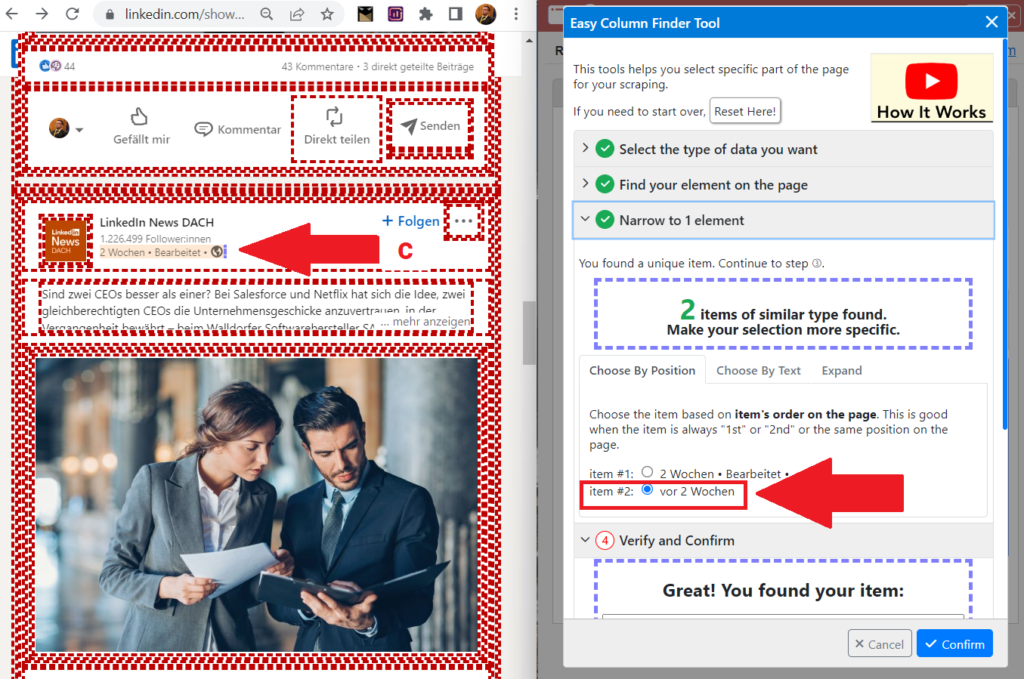
Now click the Easy Column Finder button, and click hover over the item in the LinkedIn post that contains the data for each of the columns and press the letter C.
1) Column 1: Post reactions (move the mouse pointer and type C)
2) Column 2: Date (move the mouse pointer and type C)

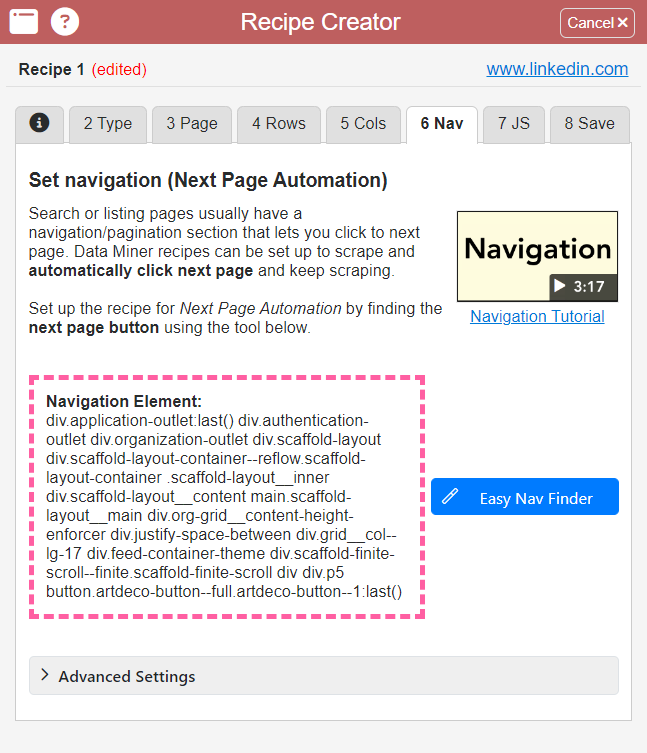
Step 5 – Set Navigation with Easy Nav Finder by Data Miner
Now all that’s left to do is find the navigation control to scrape more posts than just the ones currently visible on the loaded website. The navigation element is defined via the 6 Nav tab at the top of the Data Miner menu bar.
To do this, click on the Easy Nav Finder button. In the case of LinkedIn posts, you can briefly disconnect from the Internet for this purpose, scroll down until the “Show more results” button is visible, and then use the mouse pointer and the N key to set the navigation element as such.
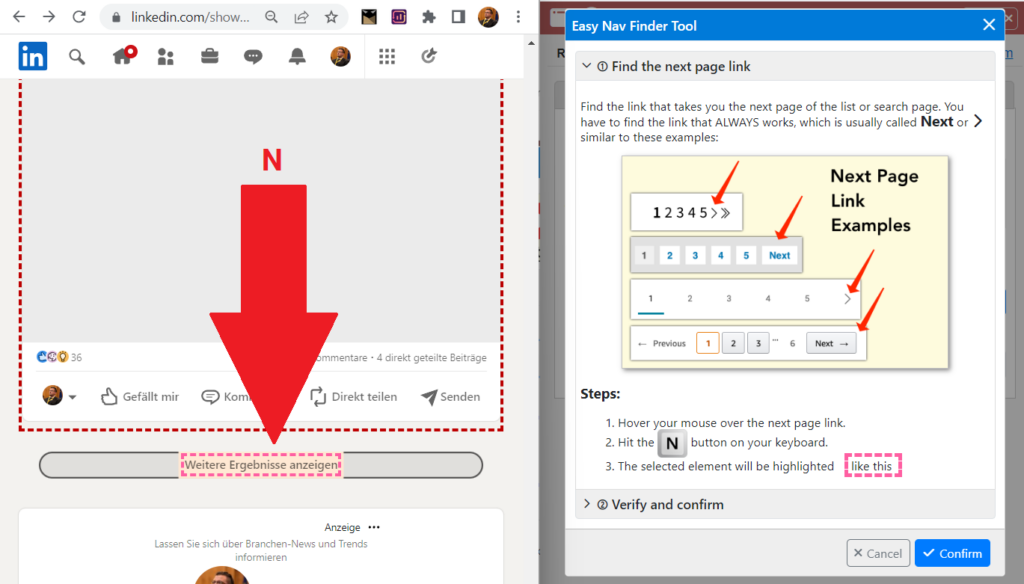

This is what it looks like when the navigation element has been found successfully.

Almost done: The scraping schedule can now be named, saved and started in the above tab 8 Save. Scroll down as deep as possible in the LinkedIn posts beforehand so that as many posts as possible are loaded.
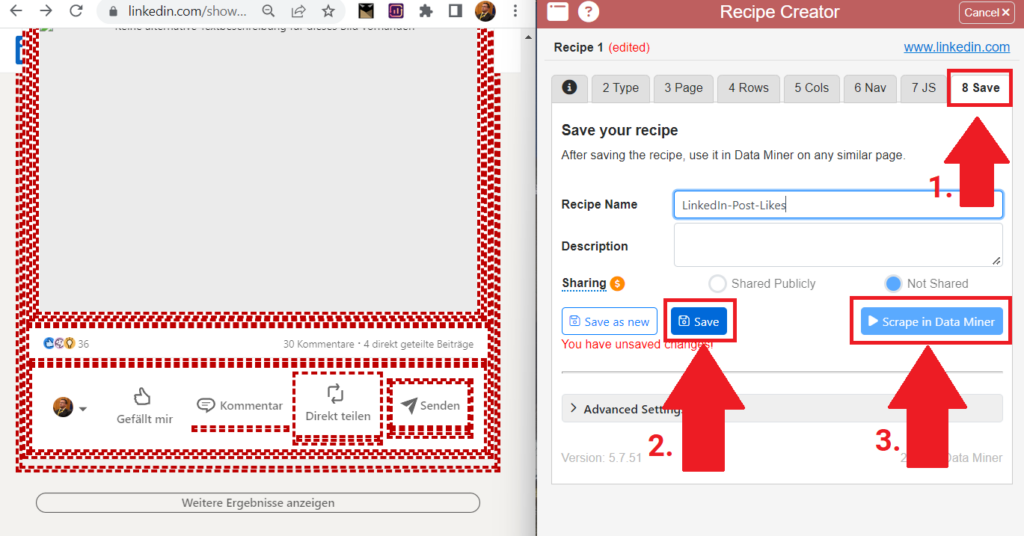

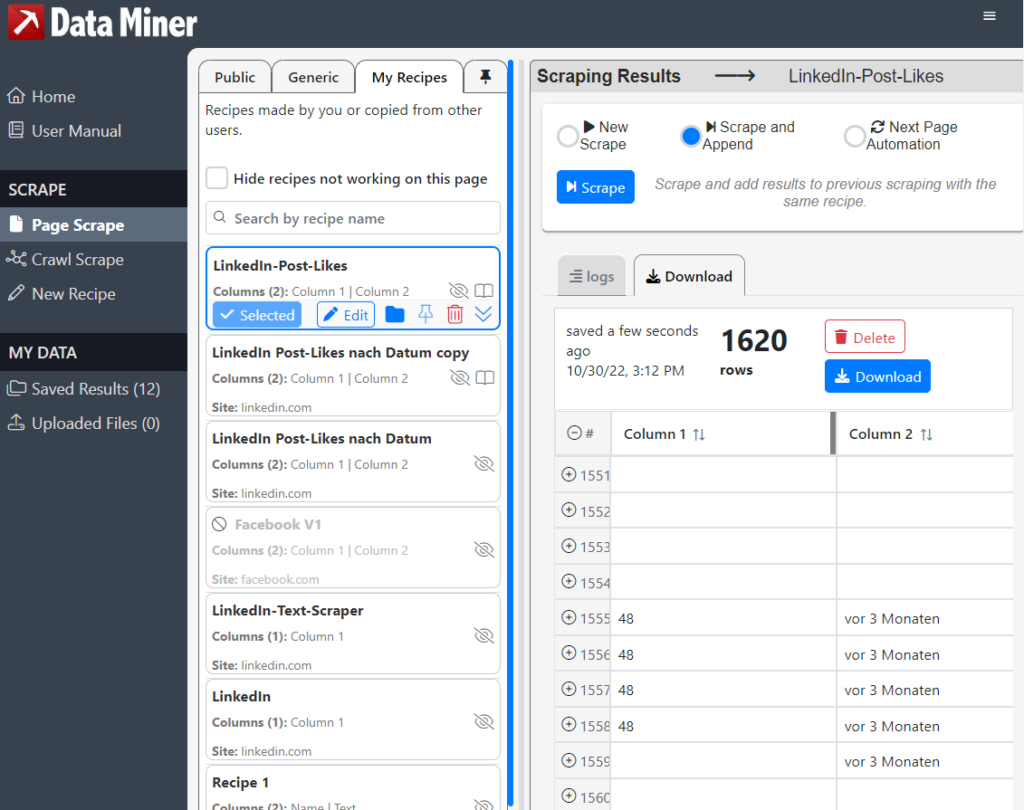
Now click on Scrape and Append.
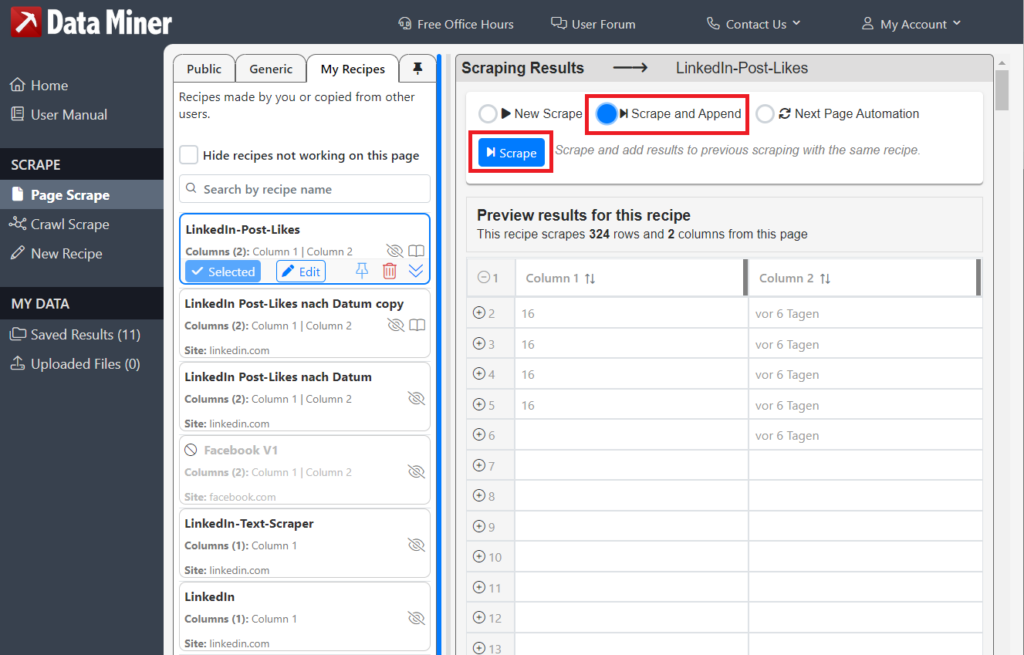

If everything went well, the data miner should have scraped the posts at least to the data depth that you loaded in the LinkedIn posts website.

Step 6 – Arrange table entries
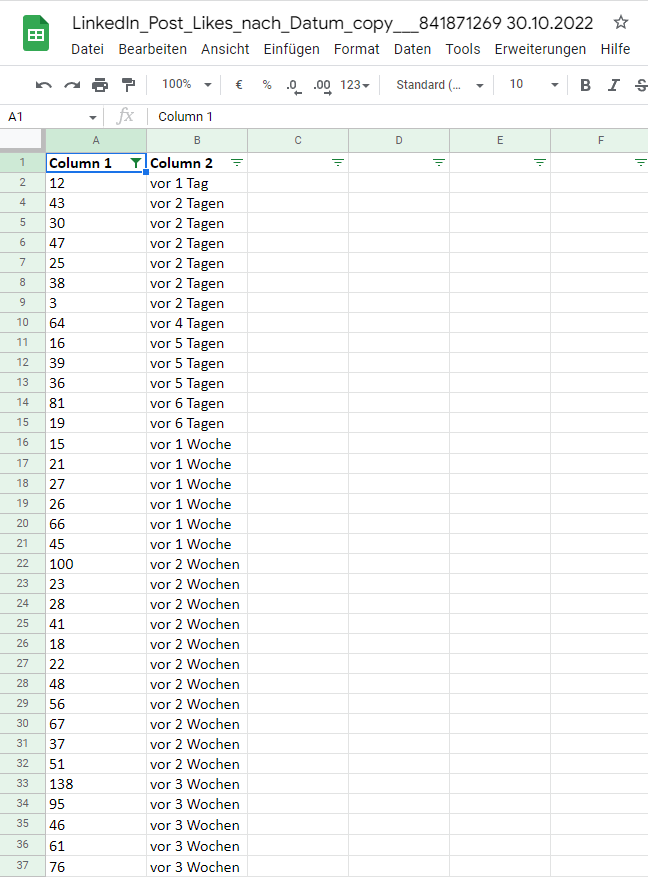
Especially with LinkedIn posts, entries for the same posts are included in the table several times. To clean this up, you should automatically remove the duplicates and automatically remove the blank lines accordingly. If you are using Google Sheets:
Remove Duplicates – go to the top menu under Data > Data Cleanup > Remove Duplicates
Remove empty rows – creates a filter in the header > selects the filter dropdown menu at Column 1 > unchecks (Empty)
Then sort the data along the timeline hierarchy and you’re done: we already have a breakdown of the post reactions of a LinkedIn account.

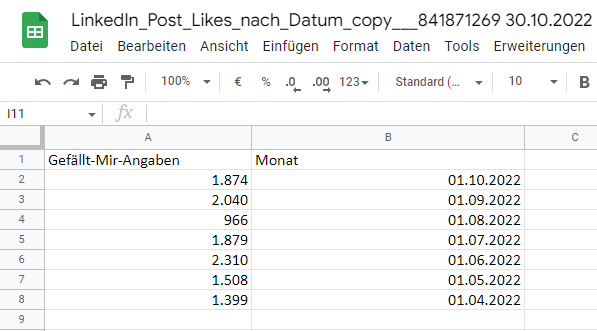
For a more stringent display, we can now create the totals for individual months so that the data can be displayed in charts in a clearer and more meaningful way.

Overview
-
In-depth analysis and full independence via data scraping with data miners
-
Step 1 – Install and launch Data Miner
-
Step 2 – Multiple Rows by Data Miner
-
Step 3 – Page & Easy Row Finder by Data Miner
-
Step 4 – Columns & Easy Column Finder by Data Miner
-
Step 5 – Set Navigation with Easy Nav Finder by Data Miner
-
Step 6 – Arrange table entries
You might also be interested in:
Track phone number redirects from Google Ads campaigns
With Google Tag Manager you can install phone number forwarding for Google Ads campaigns on your website.
Create reports with Data Exploration in Google Analytics 4
Many report views that were preconfigured in Google Analytics 3 must be manually created in Google Analytics 4.