CASE statement in Google Looker Studio (Data Studio) for grouping dimensions from Google Ads & GA4
With the CASE function in Google Looker Studio (formerly Google Data Studio), you can, for example, group several campaign names from Google Ads or cluster page titles from Google Analytics 4 (GA4) into categories – in one dimension. You can find out how to do this in this guide.
The filter function in individual diagrams in Google Looker Studio (formerly Google Data Studio) is actually sufficient for most analyses . For example, if you have several Google Ads campaigns that advertise the same product and you want a summary of the data in the Google Looker Studio, you can simply create a filter for it in the chart or table with the condition: campaign > contains > product name . This works if the corresponding product name is also in each campaign nameis stored in the same way. It works according to the same scheme if, for example, you run international campaigns and there are several Google Ads campaigns per country. If each campaign name has the country name or an abbreviation for it integrated, you can create multiple, individual chart visualizations and implement a filter for each to see the values of the corresponding campaigns by country.
But what if you don’t want to create multiple individual charts with individual filters – but want the values in one chart? Because in tables with a heatmap you can only use one dimension . In this case, you can cluster the groupings of your products, topics or lengths from Google Ads campaigns in one dimension – with the CASE function in Google Looker Studio. You can use the CASE function for all imaginable dimension names, such as:
- Grouping of page titles from Google Analytics 4 (GA4) in rubrics
- Grouping of Google Ads campaigns by products, countries, topics
- Grouping of URLs from the Google Search Console by category
- Grouping of conversion segment names from Google Ads
- Grouping of broad match and exact match options from Google Ads
- Grouping of campaigns from Facebook Ads or LinkedIn Ads
This is how it looks without the CASE function in Google Looker Studio
Here is a specific use case: We have a table with a heatmap in Google Looker Studio and the page titles from Google Analytics 4 (GA4) with active users as a dimension. The page titles correspond to blog articles revolving around a few main topics, such as LinkedIn Ads, Microsoft, WordPress or GA4. If I now want to cluster these in a dimension as rubrics to use in a table with a heatmap, I can use the CASE function. Then I can add more metrics to this table to analyze the performance of the sections.
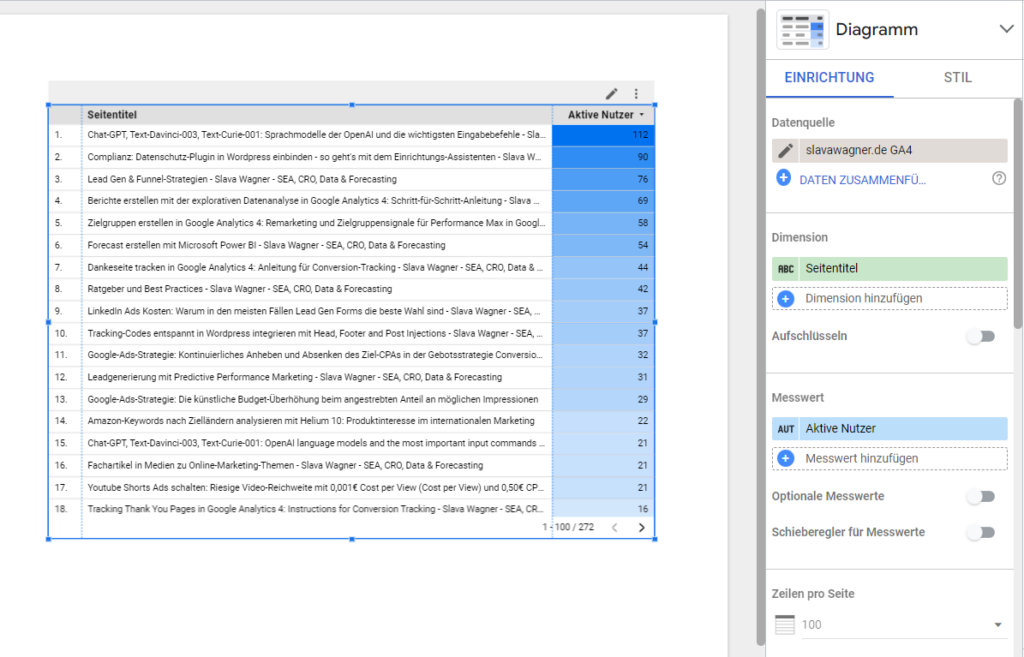
Initial situation: All page titles with active users from Google Analytics 4 (GA4) in Google Looker Studio. Without a CASE function, I can’t cluster them into categories in the table with heatmap.
Instructions: How to implement the CASE function in Google Looker Studio
To implement the CASE function in Google Looker Studio, first go to your dataset’s settings and click the ” Add Field ” button. Here you can now build in the CASE function to use this field later as a single dimension in the table with heatmap.
You can use the WHEN REGEXP_CONTAINS condition in the CASE function to filter into which categories your original dimension should be grouped. All of this is based on the names of the entries in the dimension – for example, campaign names or ad group names from Google Ads campaigns or page titles from Google Analytics 4 (GA4). You can incorporate as many groups as you want – but beware :
If your page titles from GA4 or your Google Ads campaigns can apply to several categories from WHEN REGEXP_CONTAINS , the system cannot make an adequate assignment. In such a case, you should use the WHEN REGEXP_MATCH condition and enter the full name of the campaign from Google Ads or the page title from GA4.
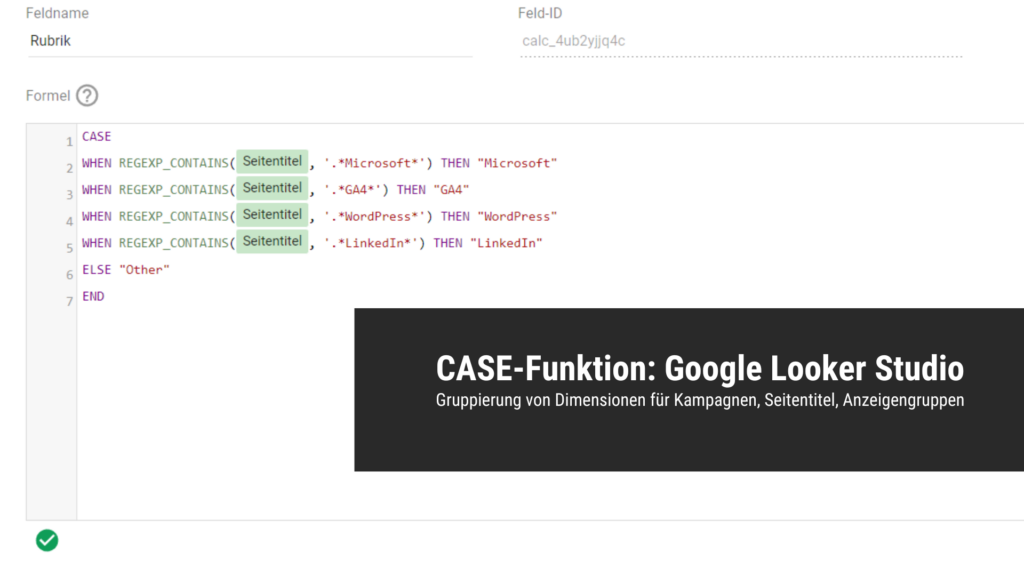
CASE
WHEN REGEXP_CONTAINS(Seitentitel, '.*Microsoft*') THEN "Microsoft"
WHEN REGEXP_CONTAINS(Seitentitel, '.*GA4*') THEN "GA4"
WHEN REGEXP_CONTAINS(Seitentitel, '.*WordPress*') THEN "WordPress"
WHEN REGEXP_CONTAINS(Seitentitel, '.*LinkedIn*') THEN "LinkedIn"
ELSE "Other"
END
This is an example of a newly created dimension (field) using the CASE function in Google Looker Studio.
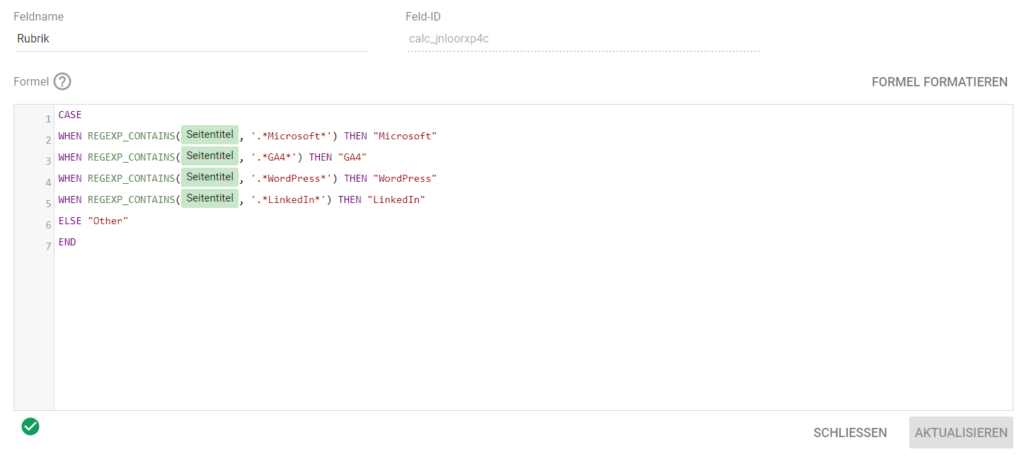
This is an example of a newly created dimension (field) using the CASE function in Google Looker Studio.
Result: Grouping with the CASE function in Google Looker Studio
Now insert the new field you created with CASE function into your spreadsheet with heatmap and you will get the grouping of your dimension values in one dimension and one chart easily and conveniently. Now you can add other metrics, such as user engagement in Google Analytics 4 (GA4).
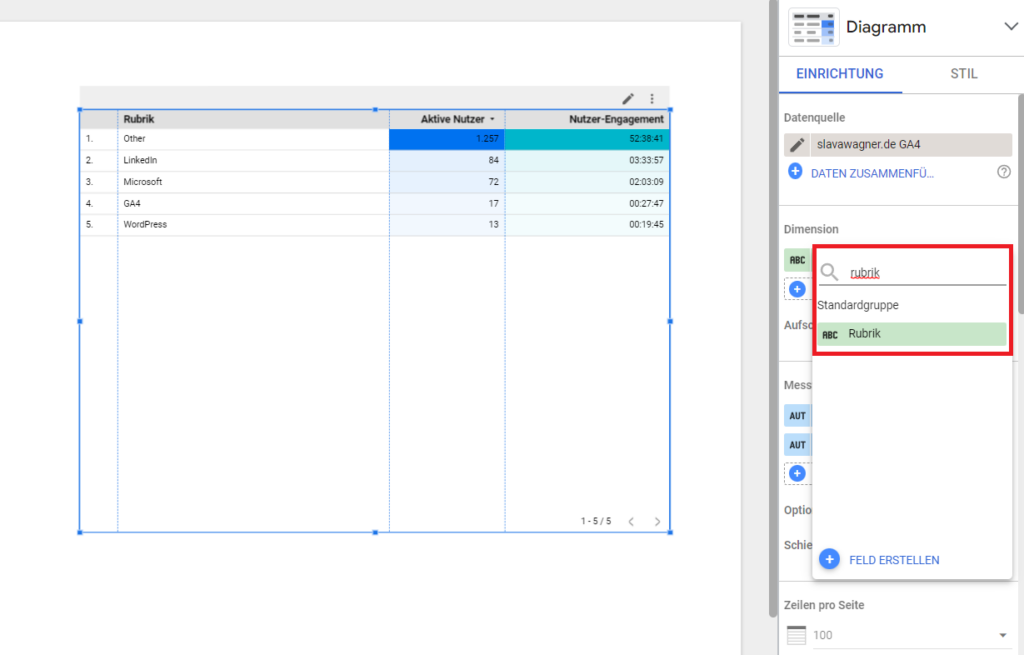
The result in Google Looker Studio: Grouping of page titles from Google Analytics 4 (GA4) with CASE function in categories. The benefit of this is that you can now see the groupings in just one chart and with just one convenient dimension. Here you can now switch on further metrics to see a comparison of the performances of the individual groups.
Do you have a question about the CASE function in Google Looker Studio?
If you’re having technical difficulties implementing the CASE function in Google Looker Studio for your data analytics, feel free to ask:
Ask your question
info@slavawagner.de
Overview
CASE function in Google Looker Studio
The CASE function in Google Looker Studio (formerly Data Studio) allows you to group dimension values in a single dimension for use in a single chart , such as a table with a heatmap.
This is useful, for example, for grouping Google Ads campaigns by product, topic or country based on the campaign name if you run multiple campaigns for one and the same item and want the values to be summarized.
You can also use the CASE function to cluster page titles from blog posts from Google Analytics 4 (GA4) into categories
Ask your question
info@slavawagner.de
FAQ - Summary of the CASE function in Google Looker Studio
Here is a summary of important and frequently asked questions about the CASE function in Google Looker Studio:
You can use the CASE function in Google Looker Studio (formerly Data Studio) to group multiple dimension values into subcategories. This makes it possible to group several Google Ads campaigns dedicated to a specific product, topic or country based on the campaign name – in just one dimension (field), which you can then store in a chart or table with heatmap.
To create a new field (dimension) in Google Looker Studio with CASE function, first go to the settings of your data source in Google Looker Studio. Then click on the “Add field” button. Then put in the code with the CASE function, which should group your dimension values into subcategories according to your ideas. You can use conditions such as WHEN REGEXP_CONTAINS or WHEN REGEXP_MATCH for this. Give the field (dimension) a name, save the field, then go to the settings of the chart or table in your report and store the newly created dimension with CASE function in the visualization so that the grouped values can be displayed.
You can use the CASE function in Google Looker Studio to create subcategories from multiple dimension values - in one dimension. This one dimension is created by a custom field with CASE function. This allows you, for example, to group several Google Ads campaigns – based on the campaign name and subcategories such as: products, countries, services or strategic approaches. You can also use the CASE function for other data sources, such as Google Analytics 4 (GA4), to group page titles from blog articles into categories – in one dimension and in a table.
You might also be interested in:
Schema markups for FAQ questions: More clicks from organic Google search
To have a chance get into the related questions section at the top of Google Search, you can set up your answered questions with FAQ schema markup.
How to install the AMP integration on WordPress websites according to GDPR
With the AMP integration you can get up to 25% more organic impressions in search engines on your website.