Measure anomalies with Google Analytics 4 (GA4) — Insights from custom statistics
Google Analytics 4 (GA4) has the unique feature of an alert system for anomalies in the performance of your websites. You can get automated notifications when a specific metric crosses or falls below a threshold. This can be done in the custom statistics of Google Analytics 4 (GA4).
With all the data that needs to be monitored in online marketing, one or the other development can quickly go under and you have to manually investigate what was the cause of a specific rise or fall . Google Analytics 4 (GA4) makes monitoring the amount of data a little easier for you: Here you can have automated alerts sent to you by email if a certain metric shows a disproportionate increase or decrease – i.e. an anomaly in website performance given is. This gives you early recognition of possible opportunities and potential, but also of possible stumbling blocks in usabilityyour site.
In case of doubt, this can give you an important information advantage if you are automatically informed when your metrics exceed or fall below certain threshold values. Google Analytics 4 (GA4) detects anomalies based on forecasts – each metric receives an automatic extrapolation – and you only receive information about a detected anomaly in website performance if the development of the metric is disproportionate to the forecast value . You can use all conceivable metrics on Google Analytics 4 (GA4) to measure anomalies, for example:
- interaction durations
- Number of users in a certain period of time
- Number of scroll movements
- number of clicks
- Number of conversions
- Sales (at an online shop)
- Bounces and interaction rates
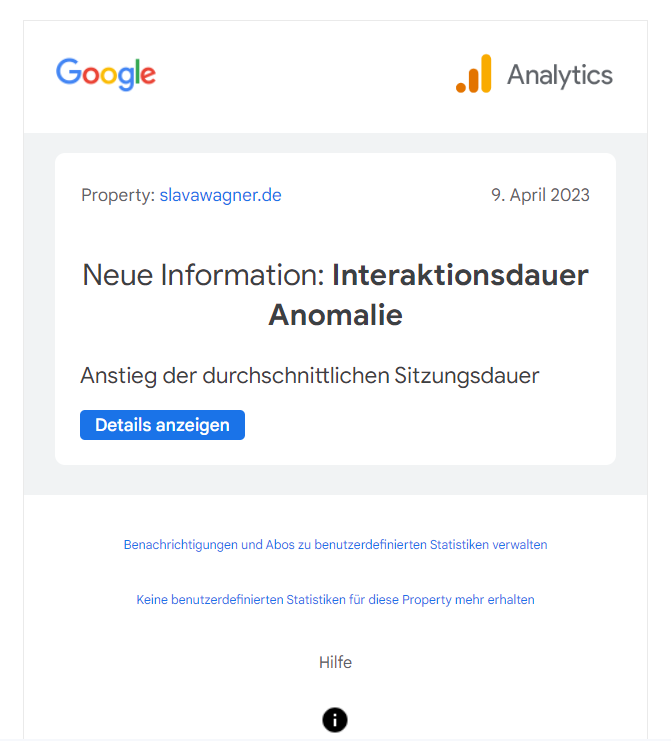
This is what an automated email would look like from Google Analytics 4 (GA4) as soon as an anomaly was detected on your website. You can just click the blue button to go straight to the custom stats that will let you know about the anomaly in Google Analytics 4 (GA4).
Anomalies in Google Analytics 4 (GA4) based on forecasts in custom statistics
If you want to create “custom statistics” yourself about measuring anomalies in Google Analytics 4 (GA4), then go to the Google Analytics 4 (GA4) home page, scroll down to “ Stats & Recommendations ” and click on the right the “ View all statistics ” link. You are now in the Google Analytics 4 (GA4) Insights dashboard and can either view automatically pre-configured anomaly reports or create an anomaly measurement yourself by clicking on the blue “ Create ” button.
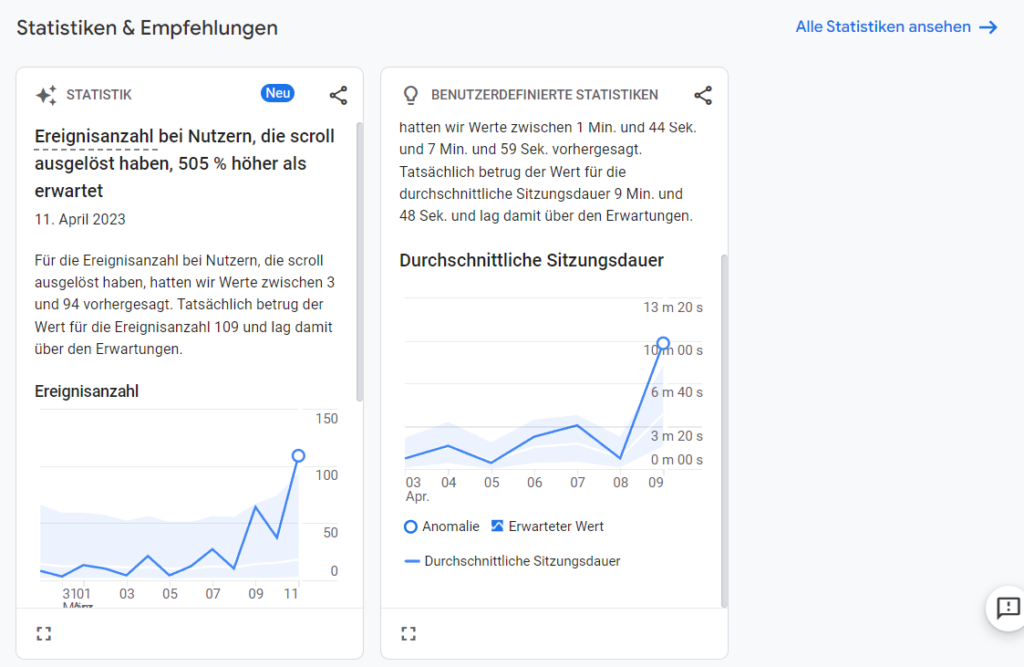
Under “Stats & Recommendations” you can see the recorded anomalies of your website performance in the Google Analytics 4 (GA4) dashboard. If you want to add more anomaly measurements to Google Analytics 4 (GA4), click “view all stats” in the top right corner.
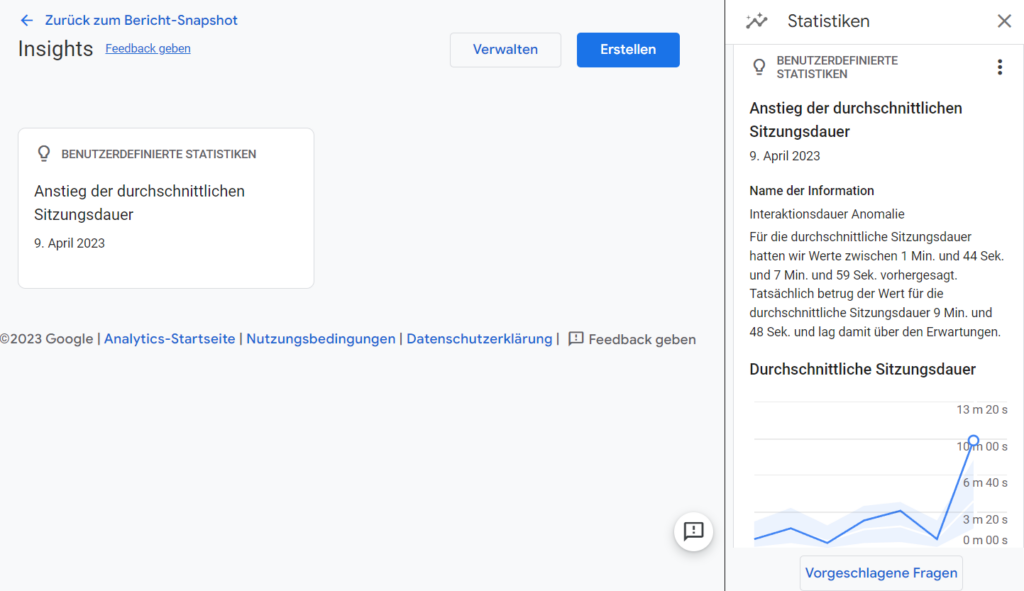
You can view your custom statistics for your anomaly measurements in the Google Analytics 4 (GA4) Insights dashboard. Click on the blue “Create” button in the upper right corner to define another anomaly measurement.
Anomaly measurement in Google Analytics 4 (GA4) — create custom information
You can then create custom information for the anomaly measurement in Google Analytics 4 (GA4). Here you can specify the frequency of the evaluation in the data monitoring (daily, weekly or monthly), as well as the user segment whose performance should be measured (all users on your website, or in the case of “change”: organic users, paid users, as well as specific target groups, if you have any built in).
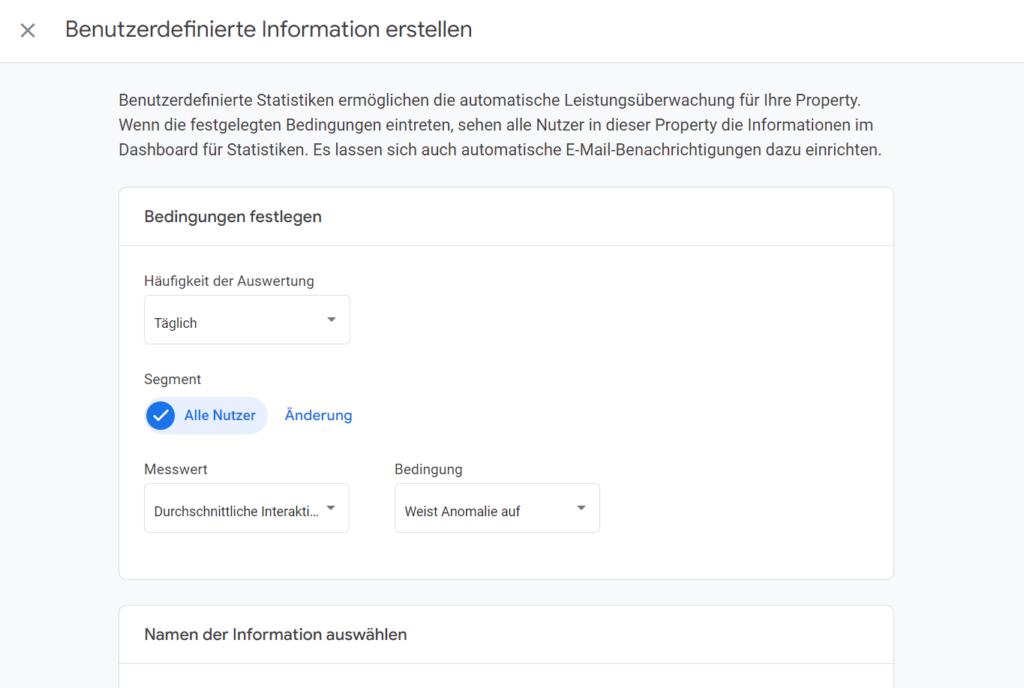
Specify the frequency of evaluation for your anomaly measurement in Google Analytics 4 (GA4) and the user segment to which the measurement should be applied.
Set metric for anomaly measurement in Google Analytics 4 (GA4)
Now you can set the actual measure (metric) for measuring your website performance anomalies in Google Analytics 4 (GA4) so that you receive automated emails with alerts. Here you can choose, for example, whether anomalies in the conversions should be monitored, the average turnover per user (for online shops), the average interaction duration per user, the number of new users or the total number of users.
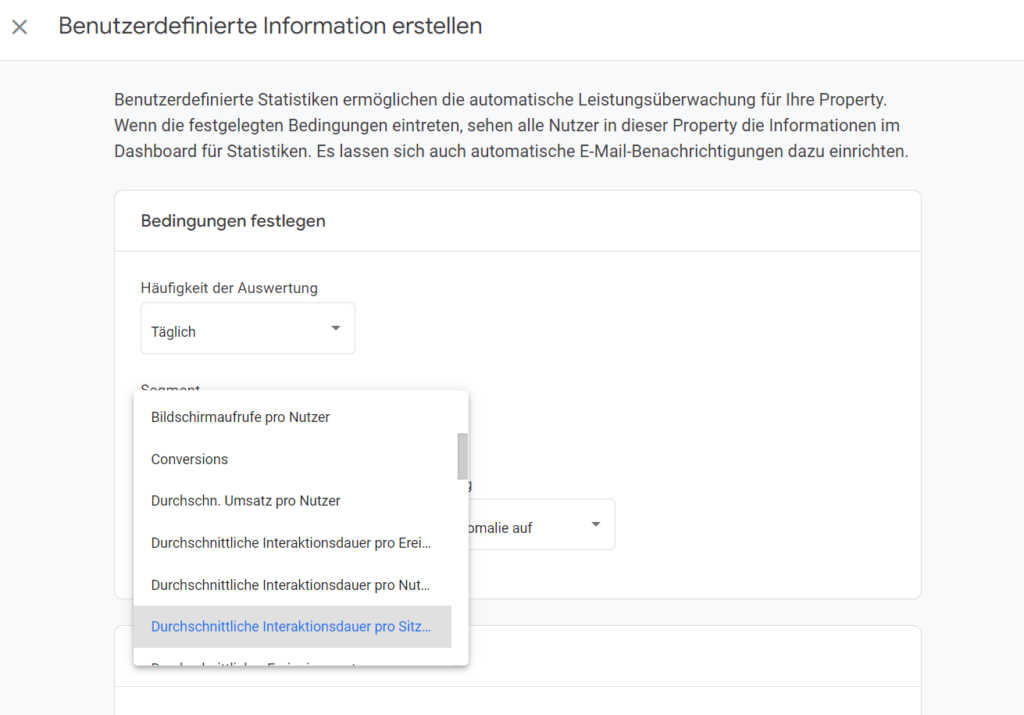
Set the metric for monitoring anomalies in Google Analytics 4 (GA4) so that you later receive automated emails with alerts and you can track the anomalies in the custom statistics.
Set condition for anomaly measurement in Google Analytics 4 (GA4)
The last step is to set the condition for your measurement. If you want to record anomalies in Google Analytics 4 (GA4), the condition in the drop-down menu should read “ Shows anomaly ”. However, you can also set other conditions for your metric, such as “ is less than or equal to ” or “ increase % greater than ”. Then click on the blue button at the top right “ Create ” and you already have your first anomaly recording in Google Analytics 4 (GA4).
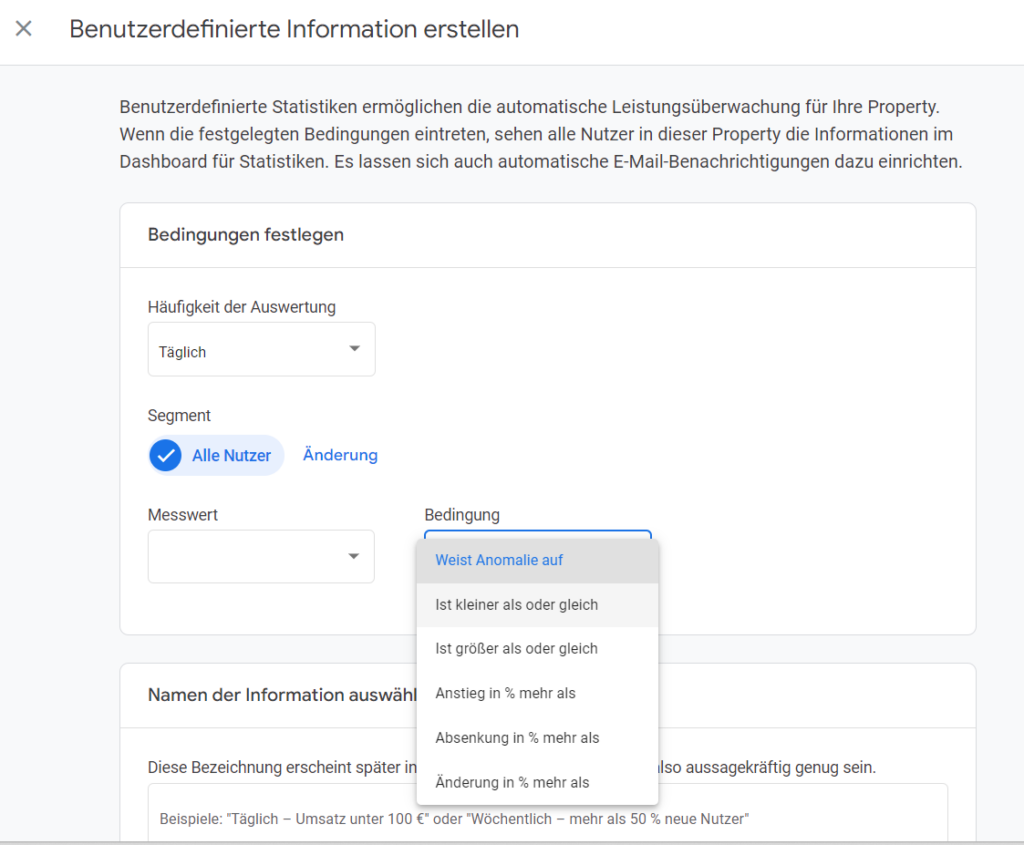
Set the condition for monitoring anomalies in Google Analytics 4 (GA4) – in this case the condition is “Has anomaly”.
Do you have a question about anomalies in Google Analytics 4 (GA4)?
Which metrics in Google Analytics 4 (GA4) are suitable for measuring anomalies – and what recommendations for action result from this if you are informed about an anomaly? Feel free to ask:
Ask your question
info@slavawagner.de
Overview
FAQ - Summary of measuring anomalies in Google Analytics 4 (GA4)
Here is a summary of important and frequently asked questions about measuring anomalies in Google Analytics 4 (GA4)
An anomaly in Google Analytics 4 (GA4) is a data measurement in the custom statistics that shows you an exceptional deviation in the development of a specific metric on your website. Forecast data is used as a basis. As soon as a metric (such as the number of users, conversions or session length) has an unexpectedly large deviation from the forecast values, you will receive an automatic e-mail with an alert and the link to the custom statistics in Google Analytics 4 (GA4), so that you can track the anomaly in the graph.
By measuring anomalies in certain metrics of your website performance, Google Analytics 4 (GA4) can send you automatic emails with alerts. This early warning gives you an informational advantage so that you can react to certain developments in good time, for example if the average session duration per user falls unusually sharply, contrary to the forecast expectation. You can use these insights to solve possible UX brakes on your website or to find another cause for the metric to crash. The same applies to the unexpected increase in a metric in your website performance.
If you set up an anomaly measurement in a Google Analytics 4 (GA4) custom statistic and an anomaly was indeed detected, it all depends on whether it is having a positive or negative impact on your website performance. For example, if the average session length is unexpectedly low over long periods of time, it could be that the website is loading too slowly or UX brakes are affecting the website’s usability. On the other hand, if the average session length is higher than expected over longer periods of time, people are more interested in your content.
You might also be interested in:
Schema markups for FAQ questions: More clicks from organic Google search
To have a chance get into the related questions section at the top of Google Search, you can set up your answered questions with FAQ schema markup.
How to install the AMP integration on WordPress websites according to GDPR
With the AMP integration you can get up to 25% more organic impressions in search engines on your website.