Exploratory funnel analysis in Google Analytics 4 (GA4) — incorporation of the funnel steps and user flow analysis
With the exploratory funnel analysis in Google Analytics 4 (GA4) you can map the behavior flow of active users on your website in a funnel diagram. You can define the individual funnel steps and data segments for the analysis yourself.
It’s always good to analyze the behavior flow of users on the website: This will tell you how high the bounce rate is on sub-pages, what the conversion rates are and what scroll depths were triggered on long content pages. All relevant points if you want to find the reason why more customers are not buying or inquiring even though you have a lot of traffic on the website. You can view this data at any time in a tabular report in the exploratory data analysis of Google Analytics 4 (GA4).
If you want an even deeper insight into the behavior flow of your website users, you can select the exploratory funnel analysis in Google Analytics 4 (GA4). The flow of active users is visualized in a funnel.
Where is the exploratory funnel analysis feature in Google Analytics 4 (GA4)?
You can access the function for using exploratory funnel analysis by clicking on the “ Exploratory data analysis ” menu item in the left-hand menu bar of the Google Analytics 4 (GA4) dashboard . Here you can perform various exploratory data analyses: In addition to the exploratory funnel analysis, there is also the exploratory path analysis , the exploratory cohort analysis, the user explorer, the segment overlap, the user lifetime report or the free format, where you can make your own configuration.
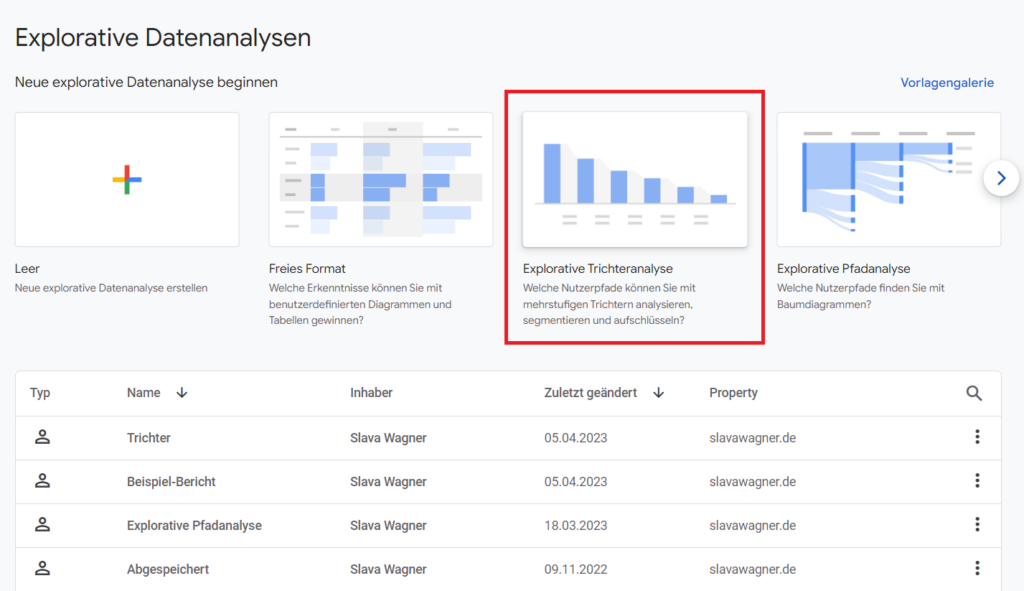
In the left menu bar of the Google Analytics 4 (GA4) start screen, click on the menu item “Exploratory data analysis” and then on “Exploratory funnel analysis” in the main window to analyze the behavioral flow of active users in the funnel.
How to set custom funnel steps in Google Analytics 4 (GA) exploratory funnel analysis?
You can set your own funnel steps in Google Analytics 4 (GA4) exploratory funnel analysis, which you can use to gradually build the path to triggering desired target actions on the website . This works with page entries as the first funnel step, but also with all page views in general, a scrolling movement , a click or the activation of a conversion action , such as submitting a contact form.
You can also narrow down the data to individual data segments under the “ Segment comparisons ” item in the left menu bar – such as paid traffic, organic traffic, social media traffic, countries and locations, device types, specific page titles, traffic from specific UTM parameters , as well as main categories of product, topic or service pages. This will only tailor the data in the exploratory funnel analysis to the segment you selected.
In the exploratory funnel analysis, click on the pencil icon next to “Steps” in the left menu bar to set the funnel steps for your analysis.
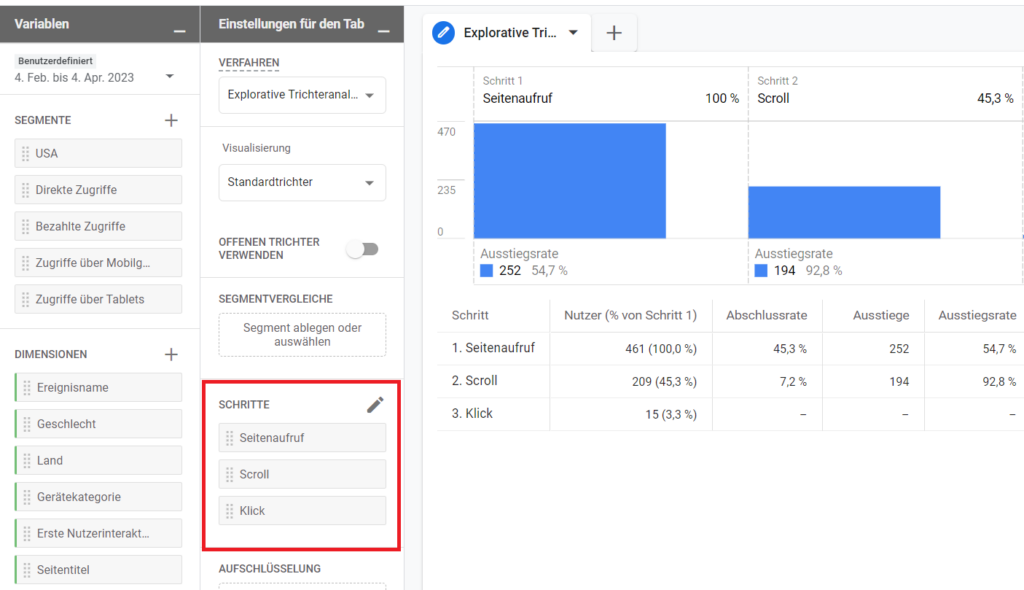
In the exploratory funnel analysis, click on “Steps” in the left menu bar to incorporate the funnel steps for your analysis.
Example: Funnel Steps in Google Analytics 4 (GA4) Exploratory Funnel Analysis
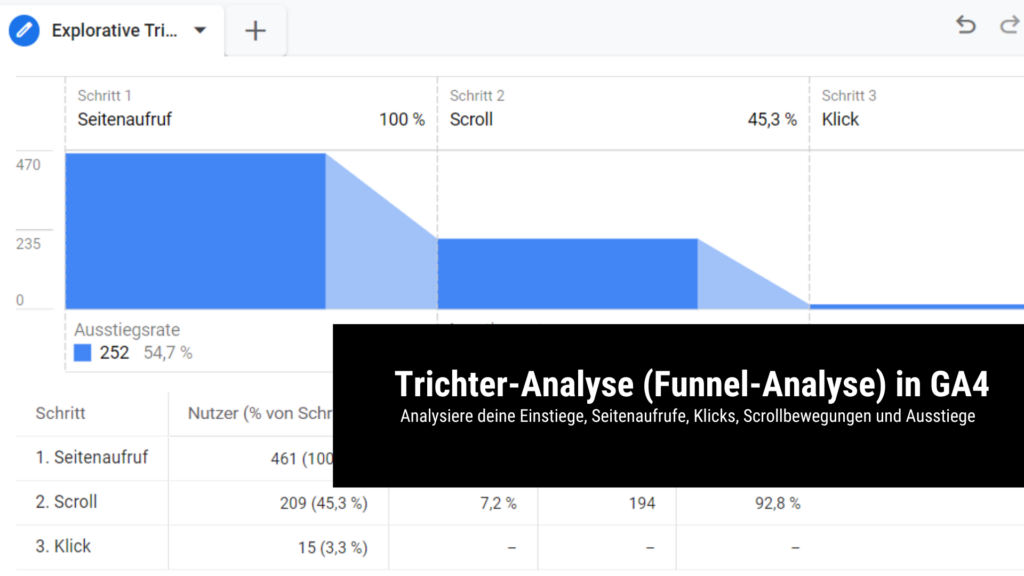
Now you can edit the funnel steps in Google Analytics 4 (GA4) exploratory funnel analysis. You can now define a Google Ads campaign , a first page increase or a shopping cart process as funnel steps, for example . In the example below, I have created a very simple funnel route: How many users made a scrolling movement after a page view – and how many of them actually clicked afterwards ? Accordingly, the example funnel consists of three funnel steps:
- Pageview (page_view) — all triggered pageviews
- Scroll motion (scroll) — all active users who triggered at least one scroll motion
- Click — all active users who triggered at least one click on the website
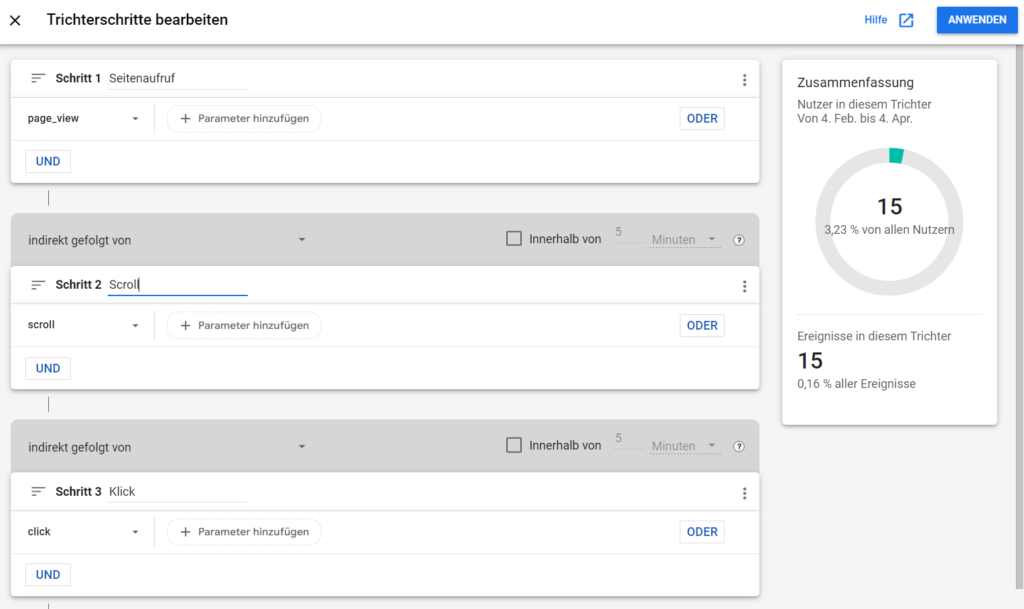
Set the funnel steps in your exploratory funnel analysis in Google Analytics 4 (GA4).
Done: Behavior Flow in Google Analytics Exploratory Funnel Analysis 4 (GA4)
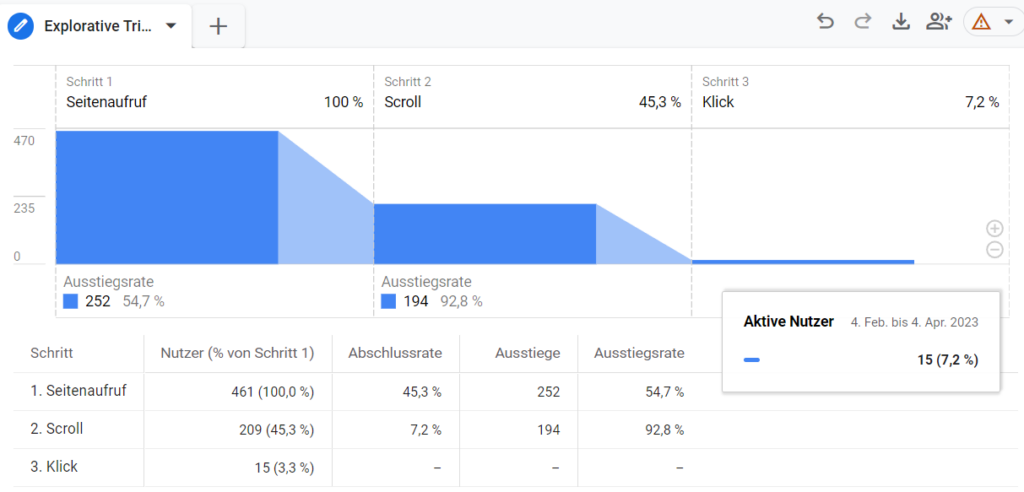
Done – now you can see in the exploratory funnel analysis of Google Analytics 4 (GA4) how many active users progressed in the behavior flow in descending steps in the target path you specified. This way you can analyze (possibly also with data segments — see above) how many users managed to reach a certain funnel step (i.e. funnel step) and what the percentage of users who made it was. In this way, comparative values and optimization potential can be determined: As youAs you can see in the example, only 45.30% of active users perform a scrolling movement and only 7.2% of users click anywhere at all.
That means: UX measures could be done here with website A/B tests to make the website head area even more appealing, as well as more interesting copywriter headlines could be created so that users feel prompted to scroll even more . For more clicks, more and more attractive call-to-action sections with copywriter headings should be included. If the UX work is completed in this hypothetical example, an exploratory funnel analysis could then be carried out again to see whether there are significant improvements in this area.
An example would look like this if you evaluated your active users from Google Analytics 4 (GA4) in an exploratory funnel analysis.
What is the Open Funnel and Closed Funnel in Google Analytics 4 (GA4)?
You can specify whether you want to use an open or closed funnel in the left menu bar in your exploratory funnel analysis — under the menu item “ Use open funnel ”. The difference between open and closed funnel is that the closed funnel only considers the active users in the dataset that are still in the funnel from the previous funnel step. The open funnel takes into account the set of all active users who appeared in the specified funnel step – regardless of the previous funnel step.
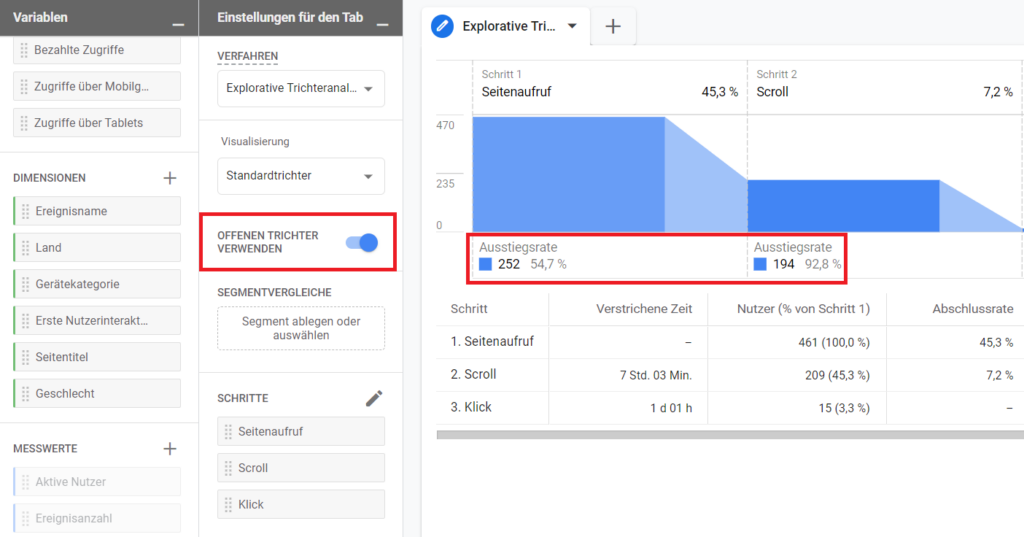
The open funnel and closed funnel indicate whether your exploratory funnel analysis should include all users at each stage, regardless of the previous funnel stage, or whether users should be closed and tracked based on the previous funnel stage.
Examine individual page titles with right-click in exploratory funnel analysis in GA4
In the exploratory funnel analysis of Google Analytics 4 (GA4), under the item “ Breakdown ” you can store the dimension “ page title ” so that you can see the funnel stages of your funnel on each individual page. In this way, you can determine on which page the greatest UX optimization potential can be found – measured in terms of click rate, conversion rate or bounce rate. In this example funnel, a low click rate would mean that you can equip the call-to-action sections with more convincing headings, or that the boxes should be placed more prominently. Below average scroll numbers would show that the head area should be made more exciting so that more users scroll down to read more.
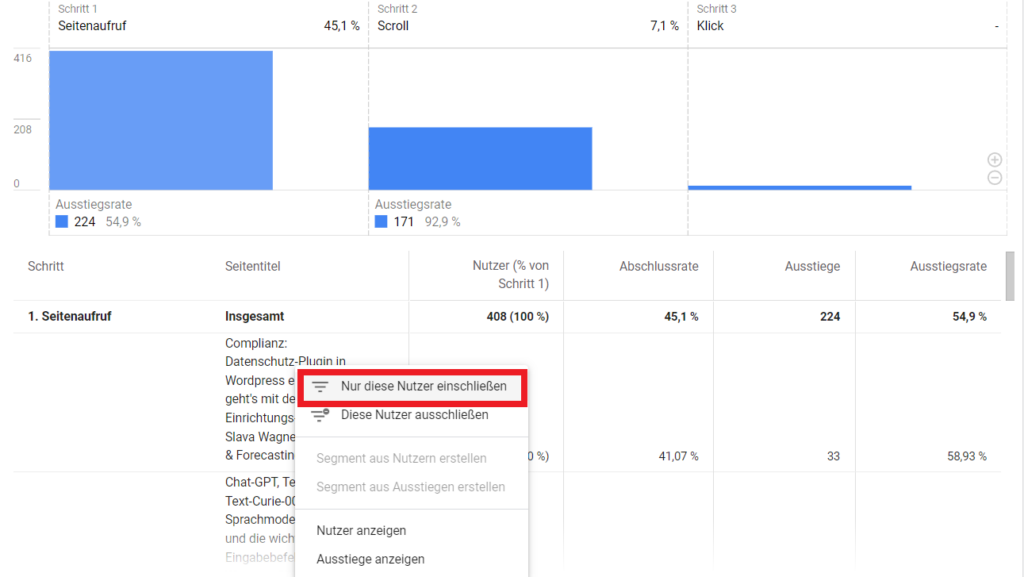
With a right-click on an individual page (page title) you can tailor the values in the exploratory funnel analysis in Google Analytics 4 (GA4) to a single page title to find out on which pages – measured on average – there is the greatest potential for optimization in the individual funnel steps gives.
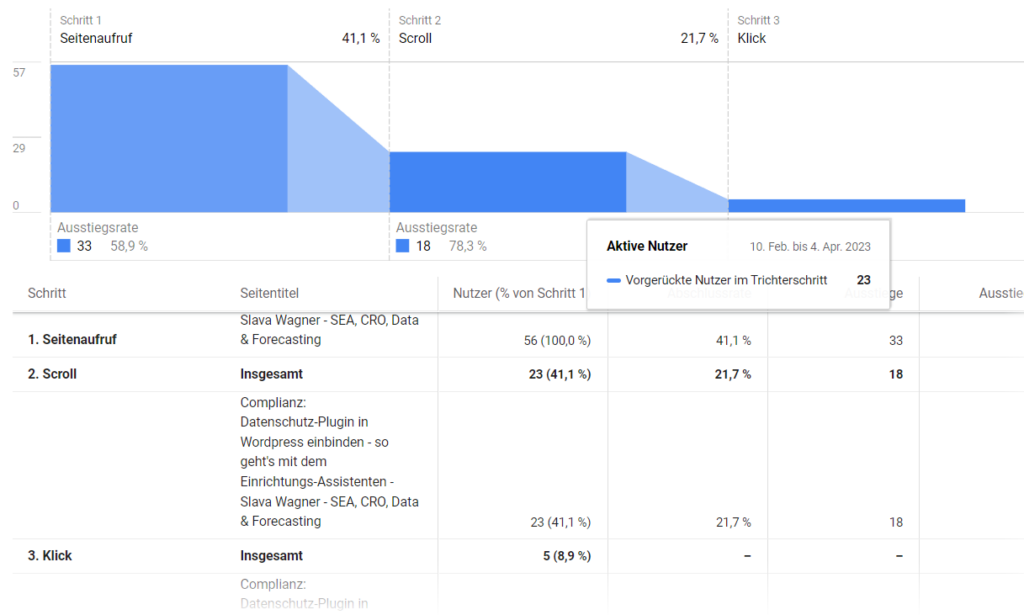
This is what it would look like if you narrowed down exploratory funnel analysis in Google Analytics 4 (GA4) to a single page to check its values in the funnel.
Do you have a question about exploratory funnel analysis with Google Analytics 4 (GA4)?
If you have questions about which UX optimization potentials you can determine with exploratory funnel analyzes with Google Analytics 4 (GA4), feel free to ask:
Ask your question
info@slavawagner.de
Overview
- Where is the exploratory funnel analysis feature in Google Analytics 4 (GA4)?
- How to set custom funnel steps in Google Analytics 4 (GA) exploratory funnel analysis?
- Example: Funnel Steps in Google Analytics 4 (GA4) Exploratory Funnel Analysis
- Done: Behavior Flow in Google Analytics Exploratory Funnel Analysis 4 (GA4)
- What is the Open Funnel and Closed Funnel in Google Analytics 4 (GA4)?
- Examine individual page titles with right-click in exploratory funnel analysis in GA4
Exploratory Funnel Analysis in Google Analytics 4 (GA4)
If you want to analyze the behavior flow of your active users from Google Analytics 4 (GA4) in the funnel, you can do this in exploratory funnel analysis.
Here you can set your desired funnel steps to see how many users progress to the next level in absolute and percentage weight on a goal leg.
This is important if you want to find out where there might be a need for action on the website so that the user can make it to the target action – for example with website A/B testing, UX optimization and copywriting texts.
Ask your question
info@slavawagner.de
You might also be interested in:
Schema markups for FAQ questions: More clicks from organic Google search
To have a chance get into the related questions section at the top of Google Search, you can set up your answered questions with FAQ schema markup.
How to install the AMP integration on WordPress websites according to GDPR
With the AMP integration you can get up to 25% more organic impressions in search engines on your website.