CPEU: Cost per engaged user at Google Ads: Why the CPEU says more than the CPC
Why companies have different results with the same ads click prices: The cost per click does not take UX values into account. The cost per engaged user, on the other hand, combines SEA and UX. This is also important, because with a CPC of €2 and a bounce rate of 90%, it costs €20 to acquire an interacting user, compared to only €3.33 with a bounce rate of 40%.
Businesses often associate their cost per click (CPC) with the industry standard purchase price for traffic from prospects. In doing so, they often wonder why in-industry competitors generate more leads with similar approaches and keywords, even though the CPCs are similar. This can have various causes, but one of the most common causes are bad UX values: low conversion rates, low scroll depths, high bounce rates.
Yet even when companies understand for the first time that with a 90% bounce rate, most website visitors aren’t even consuming the content, they still tend to cling to subpar UX scores because they believe in a myth : that you can bounce -Does not want or need visitors as customers. It is said that customers who are unwilling to consume the content are already unqualified in themselves.
However, one technical aspect is more important: only if a website visitor consumes the content of a landing page at all can he become a lead. This is a necessary but not a sufficient condition: only if the user consumes the content of the landing page can they possibly become a lead. On the other hand, if 90% of the users get nowhere in the form of jumps, these 90% will never be able to convert. When measuring traffic from ads campaigns, it makes sense to take a look at the cost per interacting user (engaged user) to find out what it costs a user who interacts with our content at all.
What is an engaged user?
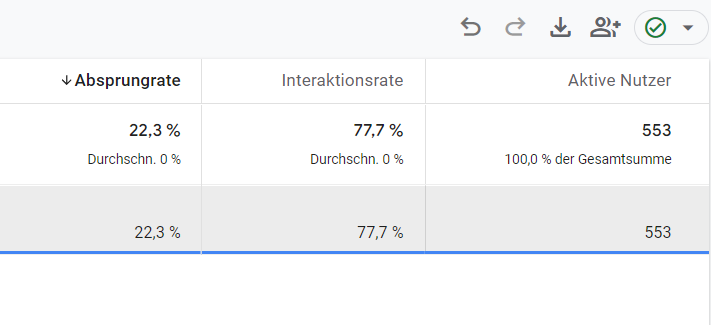
An engaged user is someone who stayed on the landing page for at least 10 seconds or performed another action on the landing page, such as clicking or scrolling. You can determine your engaged users with Google Analytics 4 (GA4) in the exploratory data analysis by using either the interaction rate or the bounces as metrics. Also, you can set a segment to filter to see how many users are coming from paid traffic to tailor metrics to just that.
An engagement rate is the percentage of your users who either stayed on the landing page for at least 10 seconds, clicked, or made a scrolling motion. The bounce rate is an inverse interaction rate and accordingly indicates the percentage of your users who did not carry out those activities and bounced. If you determine the proportion of your interacting visitors (engaged users) based on the interaction rate, you can extrapolate this to your advertising budget for the landing page in question. This tells you what a real, interacting user really costs you. This is much more meaningful than a cost per click.
How do I calculate the Cost per Engaged User (CPEU)?
To determine the cost per engaged user (CPEU) from the cost per click (CPC), you only need to extrapolate the CPC to a full 100 clicks, and then divide it by the percentage of the interaction rate from Google Analytics 4 (GA4). So the formula for the cost per engaged user (CPEU) is:
CPC • 100 ÷ engagement rate (GA4)
Here is an example of a Cost per Engaged User (CPEU) calculation:
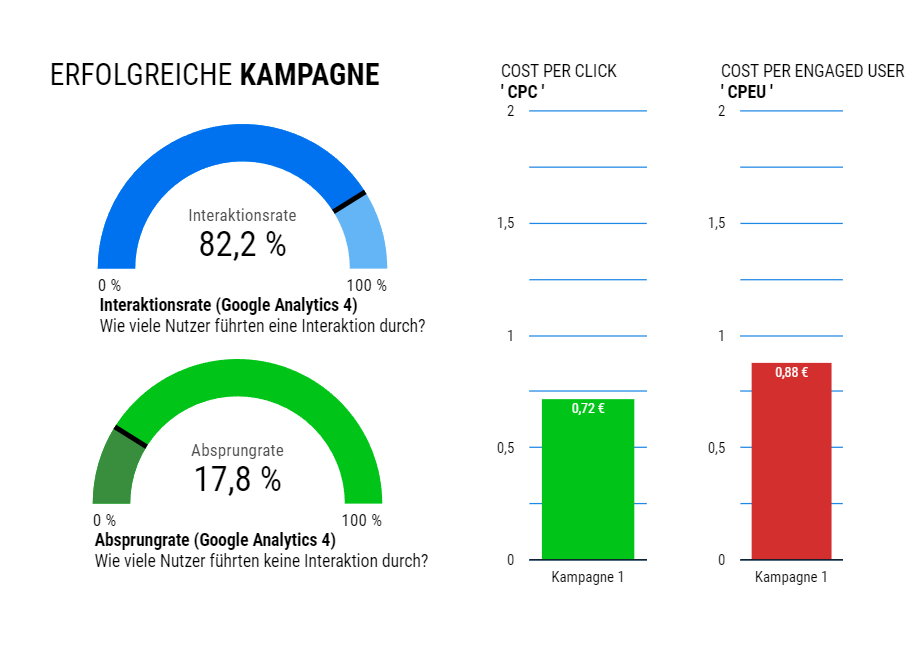
0,72€ • 100 ÷ 82,20 = 0,8759€ ≈ 0,88€
The cost per engaged user (CPEU) can vary greatly with the same CPCs because it includes UX values
Below is an example case ( Campaign 1 ) that lists two campaigns. The topic to be promoted is the same, the campaign set and keywords are the same, and the cost per click (CPC) is roughly similar. Only the landing pages are different. One landing page converted extremely well, and also has a very low bounce rate (17.80%) and a high interaction rate (82.20%). This means: 82.20% of the users from paid traffic have interacted with the landing page and have not fled directly. We can therefore assume that these are real users, and in this example calculation we pay around €0.88 for a real user on the landing page. So perfectly fine.
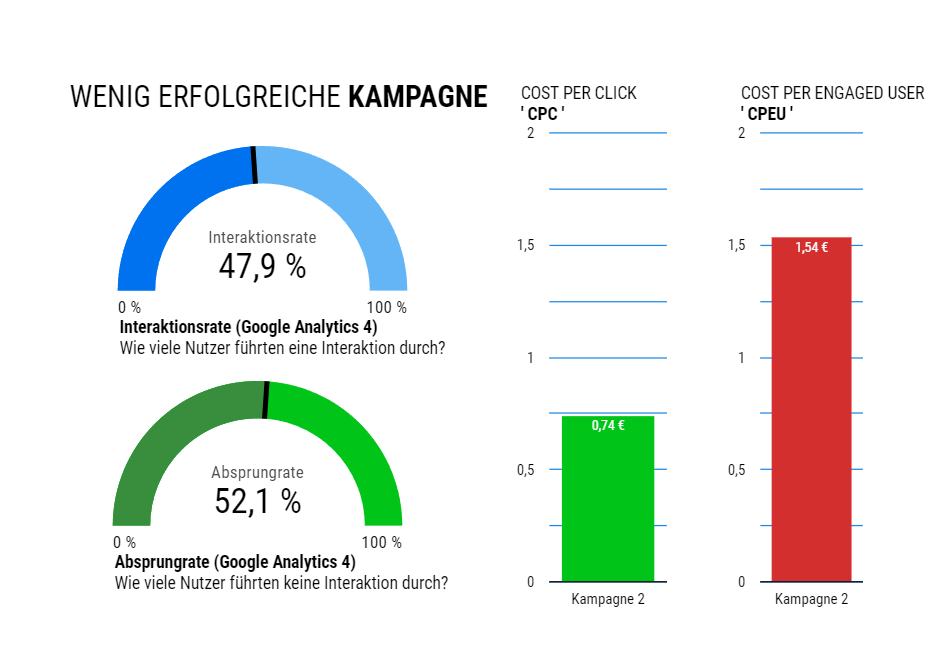
Example of an expensive Cost per Engaged User (CPEU) versus Cost per Click (CPC)
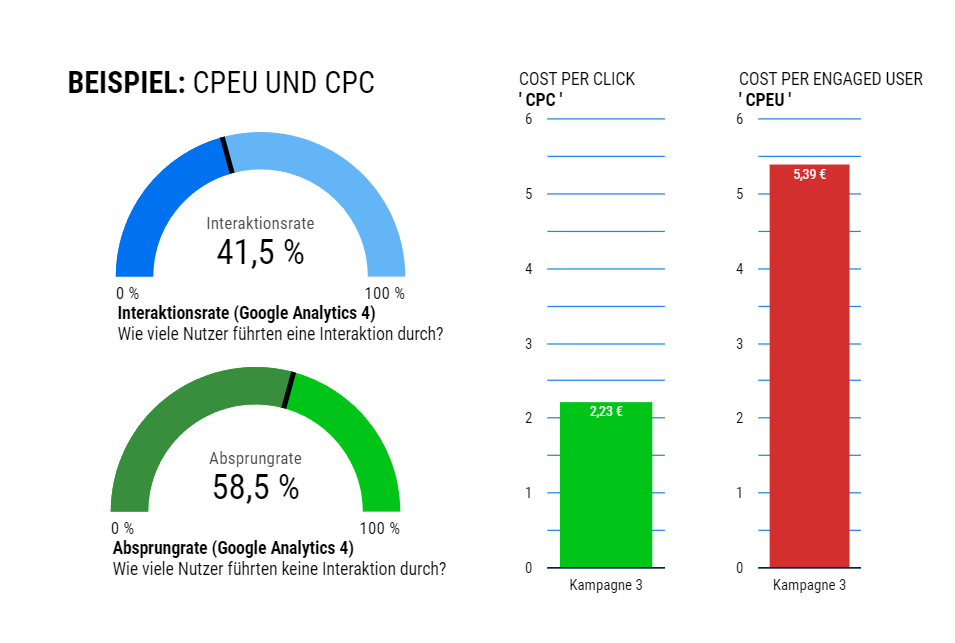
But there is another way: With the same topic, campaign and keyword set, and a similar CPC, there was a problem on another landing page ( campaign 2 ): It converted poorly and resulted in a significantly higher cost per lead. If we look at the Cost per Engaged User (CPEU), we can also see why: E ven if the CPC is roughly similar, the price for an interacting user is €1.54 (almost twice as much as in the first campaign) because the interaction rate here is 47.90%. That means: More than half of the users jump off the landing page due to below-average UX values without even having made a scrolling movement. From this we conclude: The landing page design from campaign 1 is significantly better.
Conclusion: Combine SEA and UX with the cost per engaged user
As you can see, a bounce rate doesn’t just mean some mysterious bounce—it means that the user you’re paying to acquire isn’t actually consuming your content. Only users who interact with your content even have a chance of becoming a lead. The more traffic that gets lost due to high bounce rates, the higher your Cost per Engaged User (CPEU).
This is especially critical if you are in the area of very high CPCs. If you’re paying a €30 CPC in a high-priced territory, but your bounce rate is 90%, you’ve paid €300 for just one user who even viewed the content. Of these €300, €270 went to waste because only every tenth user looks at the content. Everyone else jumped off without even making a scrolling movement. But if the bounce rate was 40%, and thus 60% of the users interacted, you would pay 50€ for an interacting user. This is absolutely critical and important in this high-priced segment, because that alone multiplies your chances of the user triggering a conversion.
How can you improve your landing page engagement rate and reduce bounces?
First of all, it is always important that there is a congruence between your ads and the landing page. If you booked a specific keyword into Google Ads, it should appear in an ad title and possibly also in the landing page, preferably in the headline. If that’s too cumbersome for you, you can also build in landing page personalization based on ad group or keyword with Google Optimize, then you can serve a customized headline to the user who comes across the ad. If the keyword and ad have little relation to the landing page, the bounce rate will also be high as users will feel that the website is not relevant to their search intent.
If your landing page is a classic conversion landing page with a rough three-part structure (head area, info area, CTA area), you can make adjustments to the individual parameters here: In the head area you can use a more captivating title, a more animated background image, a more exciting call-to-action button. In the info section, you can build in a more stringent lead to the CTA (call-to-action) section, and clearly communicate in the offer design why the added value of the product or service is much greater than the value of the purchase. In the call-to-action area, you can also add a convincing headline, make the contact form more interesting, or include pictures of contacts and expand their descriptions.
Improve landing pages with website A/B testing via Google Optimize
If you’re wondering how to improve your landing pages to improve cost per engaged user (CPEU), you can easily and conveniently conduct website A/B testing with Google Optimize. This is free for up to five parallel tests at the same time. You can edit your website from the outside in the Google Optimize front-end editor in order to then test a landing page variant against the original. The original and the trial version are served to the website visitors in equal or user-defined proportions, and the performance is measured in various metrics. In the instructions below, you will learn how to use UX design to reduce jumps, increase scroll depths and increase conversion rates.
CPC and CPEU in Google Ads
If you have any questions regarding this blog article, feel free to ask:
Ask your question
info@slavawagner.de
Overview
- What is an engaged user?
- How do I calculate the Cost per Engaged User (CPEU)?
- The cost per engaged user (CPEU) can vary greatly with the same CPCs
- Example of an expensive Cost per Engaged User (CPEU) versus Cost per Click (CPC)
- Conclusion: Combine SEA and UX with the cost per engaged user
- How can you improve your landing page engagement rate and reduce bounces?
- Improve landing pages with website A/B testing via Google Optimize
You might also be interested in:
Track phone number redirects from Google Ads campaigns
With Google Tag Manager you can install phone number forwarding for Google Ads campaigns on your website.
Create reports with Data Exploration in Google Analytics 4
Many report views that were preconfigured in Google Analytics 3 must be manually created in Google Analytics 4.