Creating reports with Data Exploration in Google Analytics 4: step-by-step instructions

Many report views that were preconfigured in Google Analytics 3 must be manually created in Google Analytics 4. But it’s worth it, because the range of data views is larger than in the predecessor. How this works in concrete terms and step by step.
With the switch from Google Analytics 3 to Google Analytics 4, quite a few things have changed in the operation of the web analytics environment. Above all, those responsible for marketing in companies and agencies are affected: They create reports for the management and have to draw conclusions from the data. The report views in Google Analytics 4 are new and so is the data recording. Here is an overview of the most important changes:
I. The changes in Google Analytics 4
Data collection: Client ID and User ID
In Google Analytics 3, users were recorded with a client ID by default. This allows the user of a device to be tracked using a browser cookie. As long as the cookie is not deleted, the user and their activities on the website can be tracked in the user explorer. The client ID is used to uniquely assign a user.
On the other hand, there is the user ID, which is much stronger in user tracking because, in addition to browser cookies, it can assign the user across devices and browsers based on various characteristics. This means: This is not browser-based cookie tracking, but standard cross-device and cross-browser tracking, which enables us to better understand the user’s customer journey. As a result, Google Ads can also maximize the conversion number of a campaign even better, since the system “knows” when and at which touchpoints the user can be picked up – across devices.
As a result, a user can be booked as an active user in the system – and does not appear multiple times in the reports. So very handy for precise, accurate and representative conversion tracking. Even in Google Analytics 3, it was possible to switch to tracking using a user ID. In Google Analytics 4, the user is tracked with the user ID by default – with all the advantages mentioned.
More data: Click tracking integrated by default
Google Analytics 4 has functions that were previously only available in Google Data Studio or Google Tag Manager. Google Analytics 3 had no system-internal click tracking, which was necessary for tracking button clicks or clicks on telephone numbers and E -Mails would be relevant. Such tracking was recorded via Google Tag Manager and imported into Google Analytics 3 as an event. From there, the event could be set as a goal and then imported into Google Ads as a conversion action. In Google Analytics 4, clicks can now also be recorded system-internally. The same applies to downloads.
Report View: Drag-and-drop editor similar to Google Data Studio
The report editor in Google Analytics is a drag-and-drop editor reminiscent of Google Data Studio. The way it works is similar: we have to define dimensions, metrics and segments ourselves.
Dimensions: Dimensions describe the axis labels in a chart or table. Put simply, dimensions are dimensions that are outside of the chart or table. Typical dimensions are:
- Date (Years, Months, Days)
- Users with User ID
- page title
- Google Ads campaigns
- UTM parameters
- Traffic Sources
Metrics: Metrics are measured values. Put simply, metrics describe the measured values that are contained within a chart or table. Typical metrics in Google Analytics 4 would be:
- pageviews
- user
- new users
- active users
- interaction duration
- interaction rate
- scroll depth
- conversions
- conversion rate
Segments: Segments reflect the breakdown of data into subsets. Typical segments would be:
- Traffic from organic Google search
- Traffic from paid Google Ads campaigns
- Traffic from social media channels
- Traffic from UTM campaign parameters
- Users who have recorded a conversion
- Users by device type
- Users by configured device language
- Users by longitude/latitude or state or state
What did the reports look like in Google Analytics 3?
A lot was clearly preconfigured in Google Analytics 3: We could open the page report from the start screen, which showed us which subpages of our website were visited how often, how high the bounce rates were and how long the users stayed. Using the preconfigured system segments, we were able to segment according to organic or paid traffic and, if desired, create our own segments.
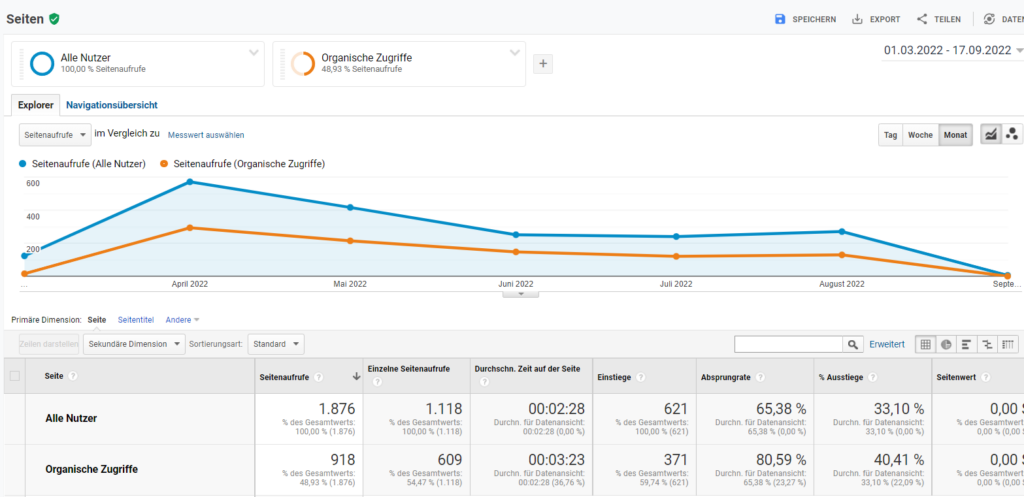
Preconfigured report view in Google Analytics 3.
What has changed in Google Analytics 4?
The preconfigured report views in Google Analytics 4 are not available in this depth. In Google Analytics 4, we only have a few standard overviews available for viewing our data. So we see a simple breakdown of visited subpages in the left menu under Reports.
Left Menu Bar > Reports > Engagement > Pages and Screens
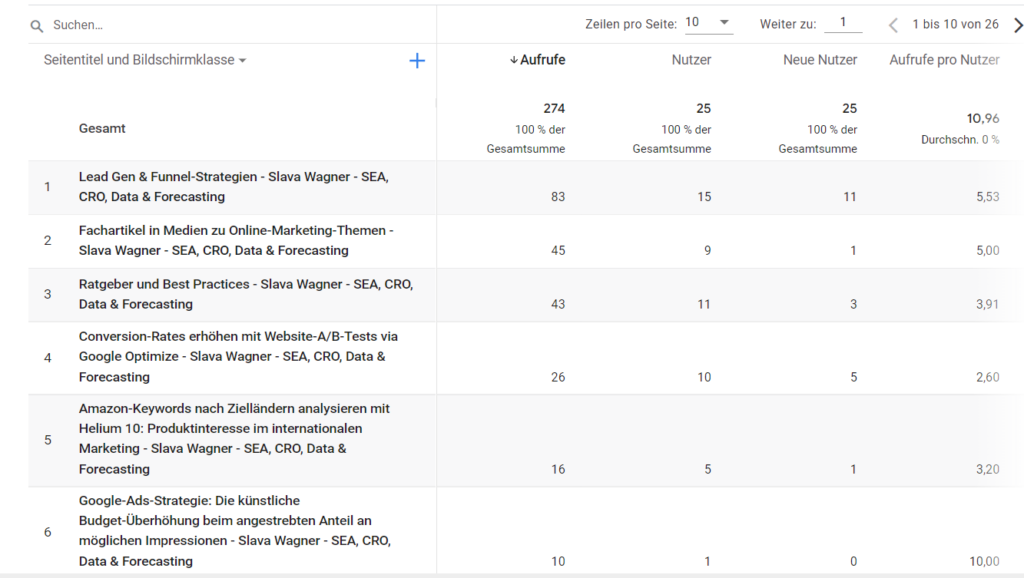
Preconfigured report view for page titles and page views in Google Analytics 4.
As you can see, we don’t have a breakdown here of what user behavior and dwell time was like. Also, here we no longer have classic, preconfigured system segments that we can use to segment traffic into organic and paid traffic – we would have to create them ourselves.
II. Introduction to exploratory data analysis with Google Analytics 4
For segmentation and deeper insight into data, we need to start exploratory data analysis. In short: It offers many more possibilities in the data views, but also needs more input from our side. This is suitable for insight into the pages visited, length of stay, jumps, interactions, UTM data and much more. To open the exploratory data analysis, we click Explore in the left menu bar, and then click Empty in the middle dashboard panel:
Left Menu Bar > Explore > In the center of the dashboard click: Empty
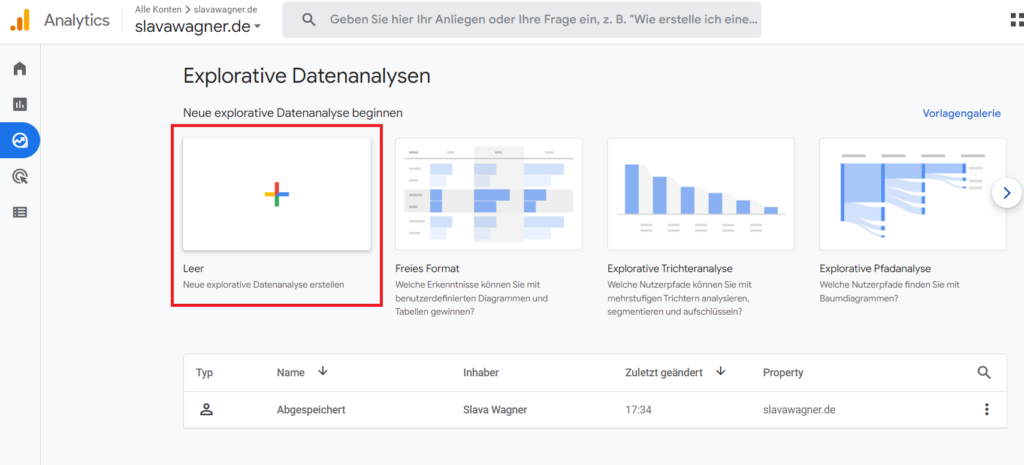
Figure: Main view for data explorations in Google Analytics 4 (GA4). Select the Empty field.
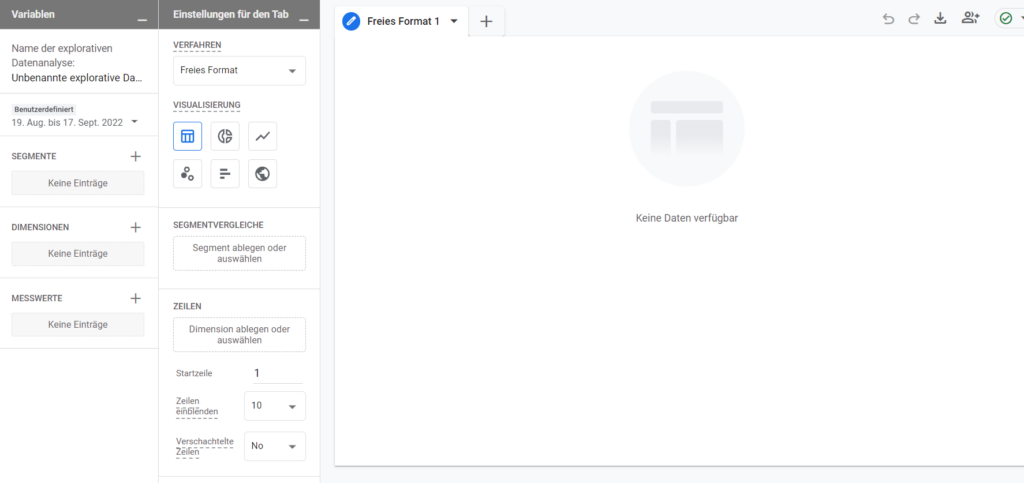
We have to enter all dimensions, metrics (measured values) and segments manually in the report for data explorations in Google Analytics 4 (GA4).
Now we have a completely empty report. Don’t worry: after we create the first report, we can save the report and access it at any time.
Step 1: Set dimension
To fill the blank report with data, let’s start by defining a dimension. Simply click on the plus symbol for dimensions.
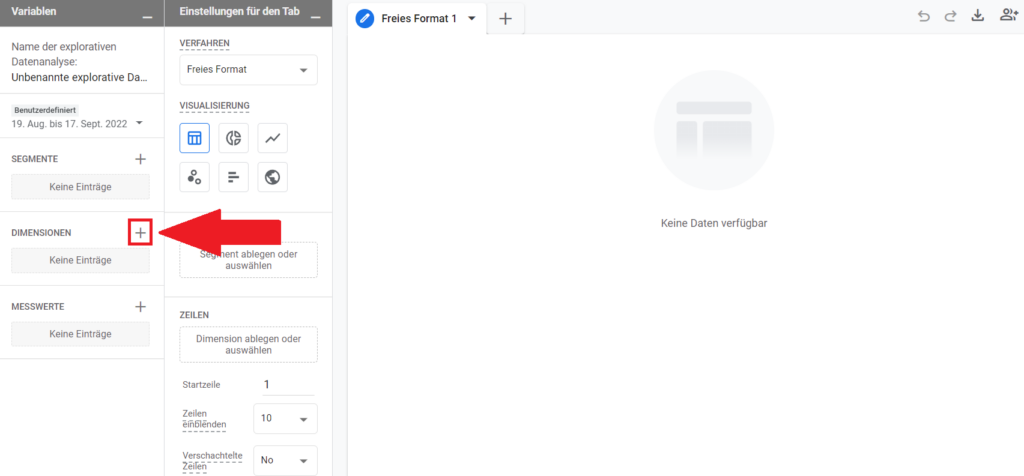
Import the needed dimensions in data explorations in Google Analytics 4 (GA4).
Select and import page titles
We can set any imaginable data as a dimension here. However, since we normally want to evaluate user behavior on visited websites, we primarily need the page title dimension. This will later appear in the left-hand table rows with the itemized sub-pages.
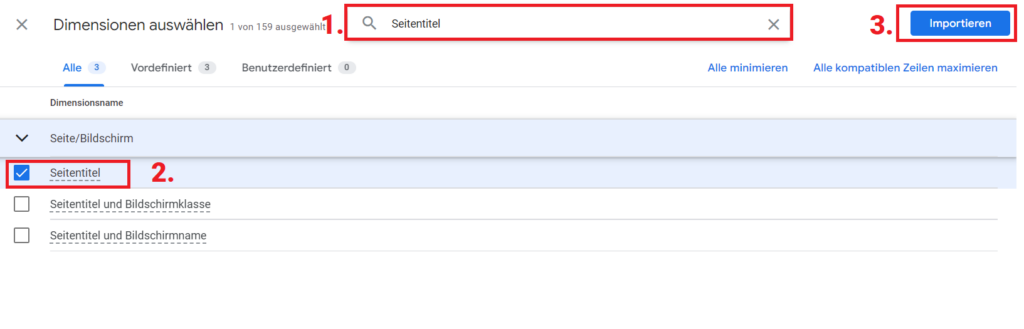
Select your dimensions in data explorations in Google Analytics 4 (GA4).
Drag page titles into rows
Page titles have now been imported into the report as a dimension. Now the dimension needs to be dragged and dropped into the report rows. Simply click on the page title and drag it into the Rows field.
Increase row limit
You can also set the number of lines to show from 10 to 100 or more, otherwise the system would only display a maximum of 10 lines (i.e. a maximum of 10 page titles).
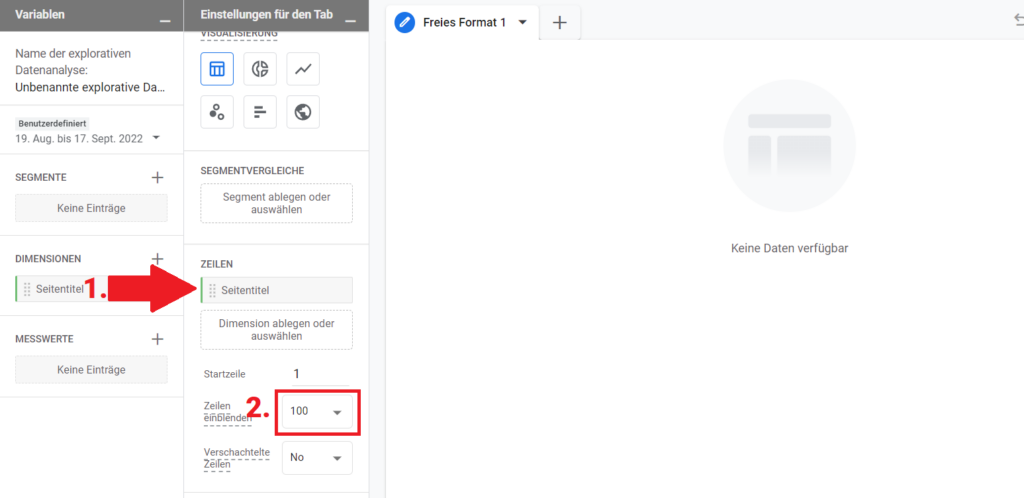
Drag page title to Rows box and increase row limit in data explorations in Google Analytics 4 (GA4).
Step 2: Set metrics
We now do the same with the metrics. Here too, from the huge pool of metrics, those that we really need must first be activated and imported. First click on the plus symbol for metrics.
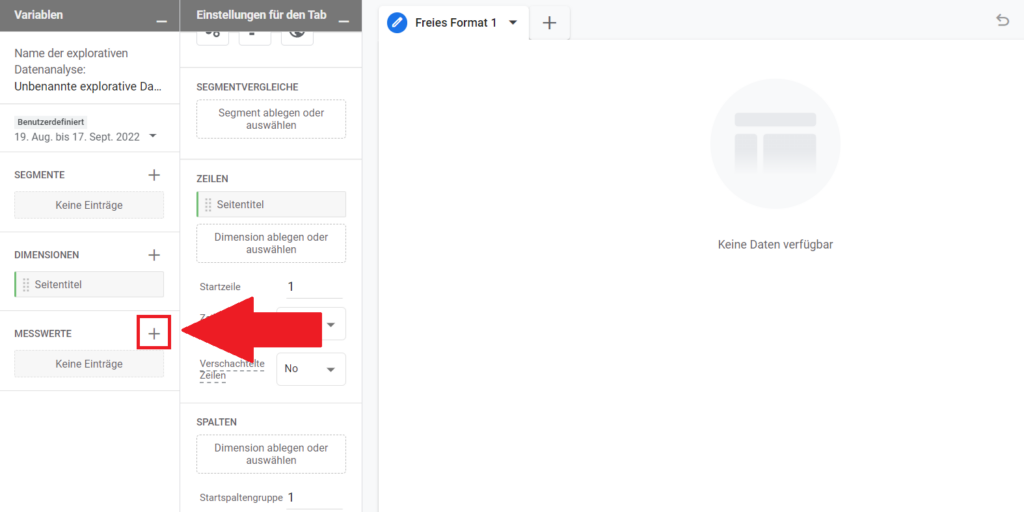
Import your metrics in data explorations in Google Analytics 4 (GA4).
Select and import active users (optional additional metrics).
Tick the metrics you want. Active users are the most representative, because they describe unique users who have been recognized as one and the same user across devices and each appear in a counter. This allows us to see how many unique, real users our website really has. You can also search for other metrics in the top search box. For example, I added the average interaction time per session here. Then click on the blue ‘Import’ button in the top right corner.
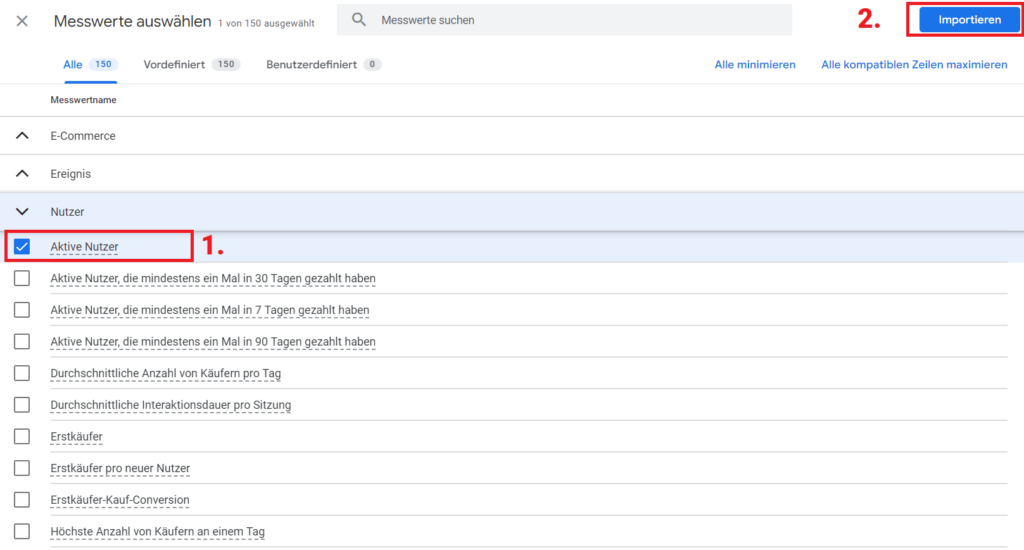
Select your metrics in data explorations in Google Analytics 4 (GA4).
Pull active users into values
After the metrics are imported, all we have to do is drag them into the Values box. You can also drag several metrics into the Values field – then these will also be displayed in the table.
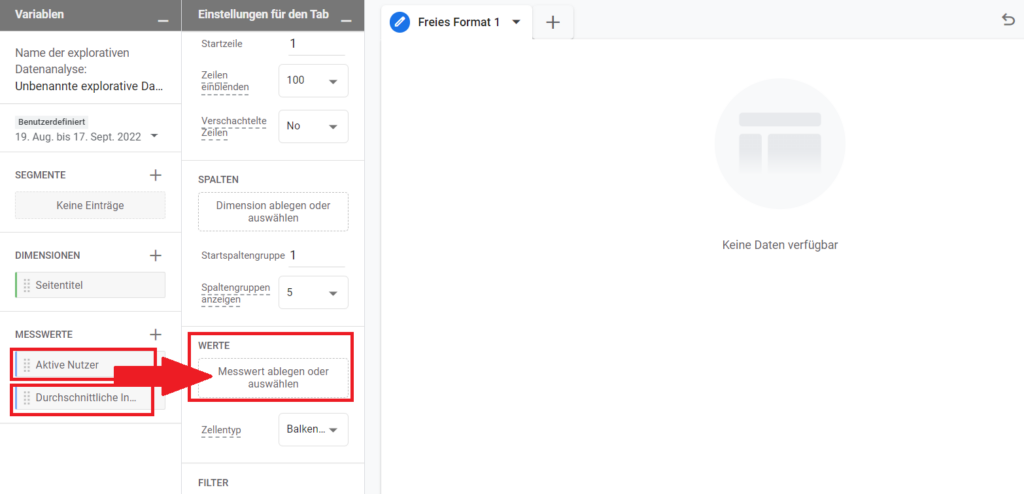
Drag active users into the Values field in data explorations in Google Analytics 4 (GA4).
Done: This is what a tabular data view looks like
We can model the table that we now have in any way, with additional metrics, such as interaction rate. Unlike the bounce rate from Google Analytics 3, the engagement rate reflects the percentage of users who engaged further. That means: the higher the better.
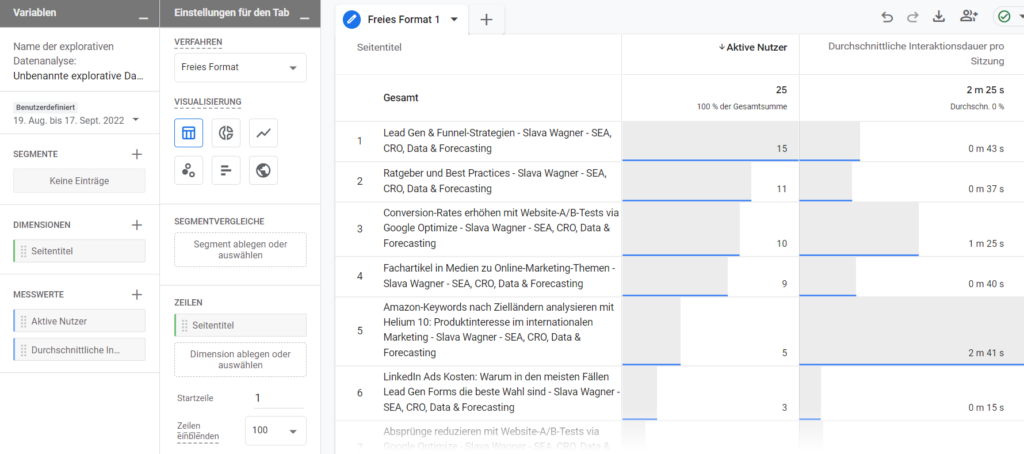
Final view with dimensions and metrics (measurements) in data explorations in Google Analytics 4 (GA4).
Step 3 - Set Segments
In the last step we can now define segments. In practice, we usually need segments for traffic sources. That is: How did the users from a certain traffic source behave? To do this, we click on the plus symbol for segments.
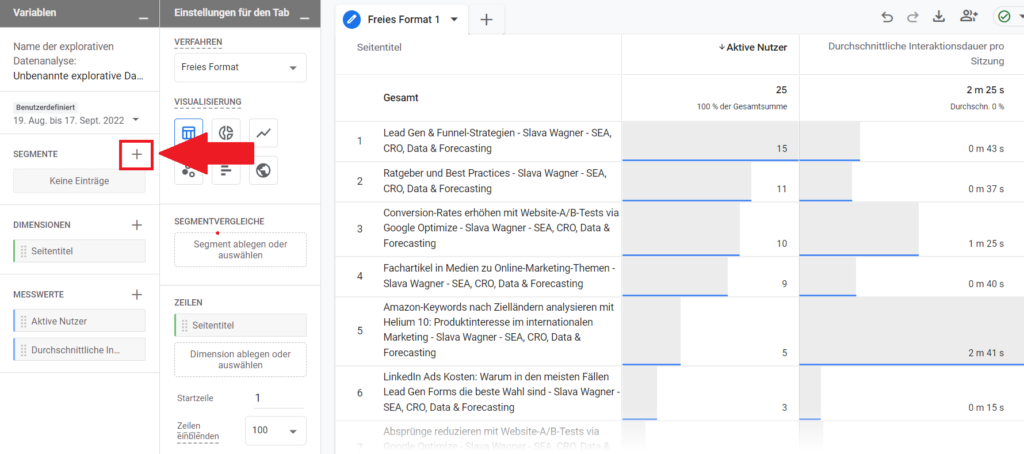
Set your segments in data explorations in Google Analytics 4 (GA4).
Now select the User segment field.
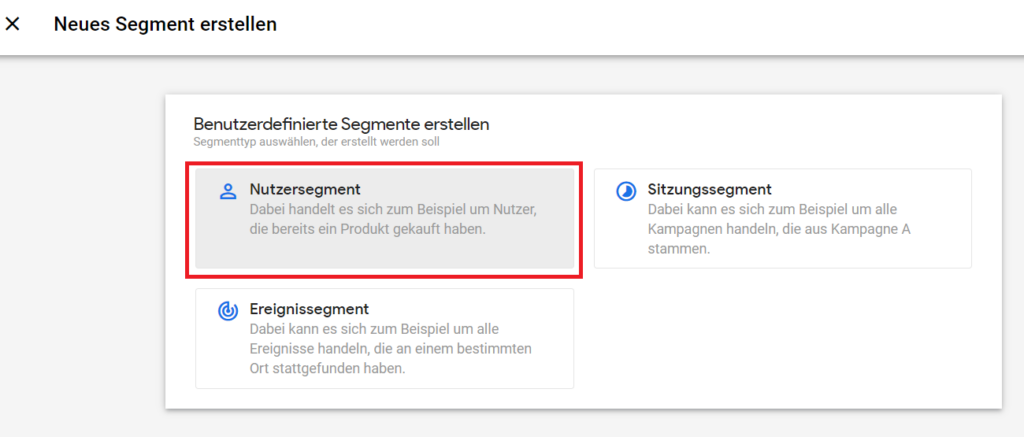
Select the User segment field in data explorations in Google Analytics 4 (GA4).
Now click on New condition.
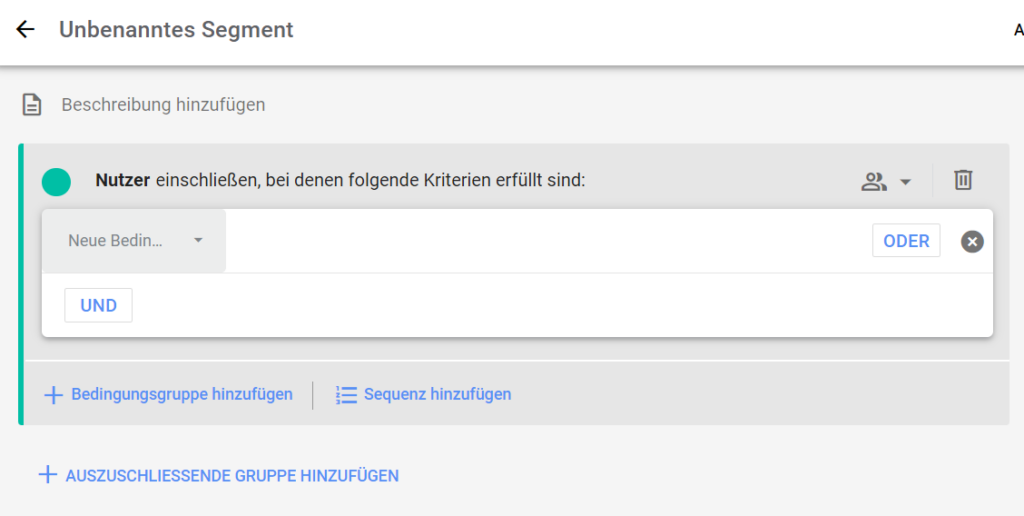
Click on Select new condition in data explorations in Google Analytics 4 (GA4).
Parameter: "Medium" for organic and paid traffic
Paid traffic from Google Ads and organic traffic from Google Search are segmented using the Medium parameter. Enter medium in the search field and select Session – Medium.
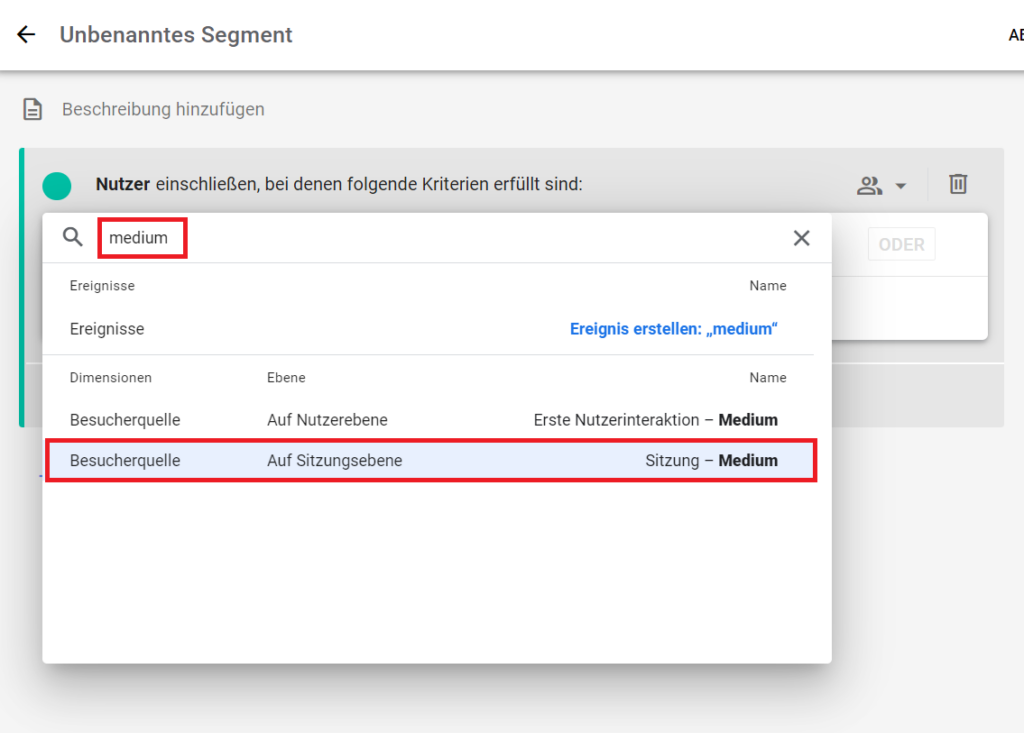
Look for the Medium parameter. Then click Session – Medium in data explorations in Google Analytics 4 (GA4).
Now click on Add filter.
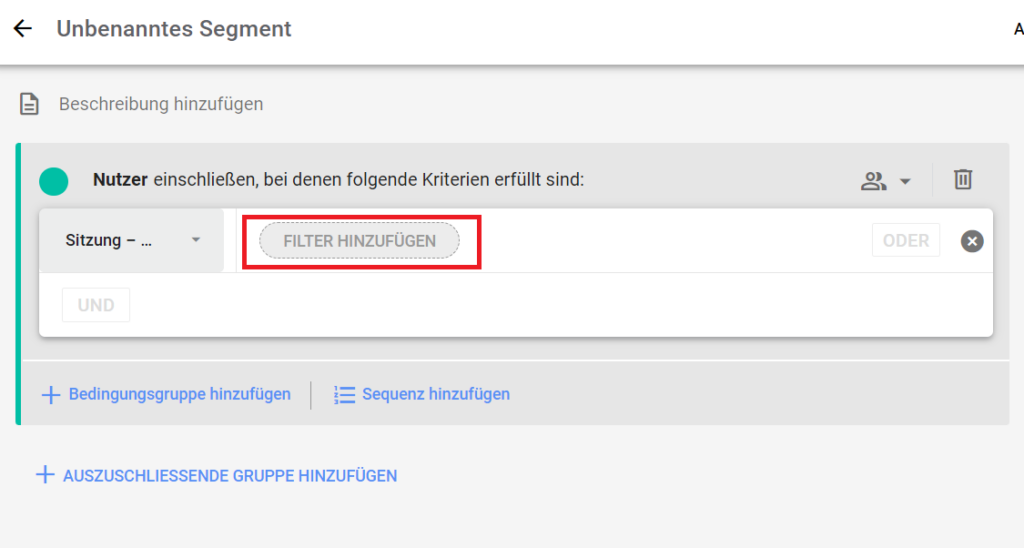
Click Add Filter.
Enter in the field under the condition "contains":
organic
for organic traffic segmentation
cpc
for segmenting paid traffic
or another name for medium if you used a UTM parameter in your links that has clearly separated parameter names for medium.
Then click Apply.
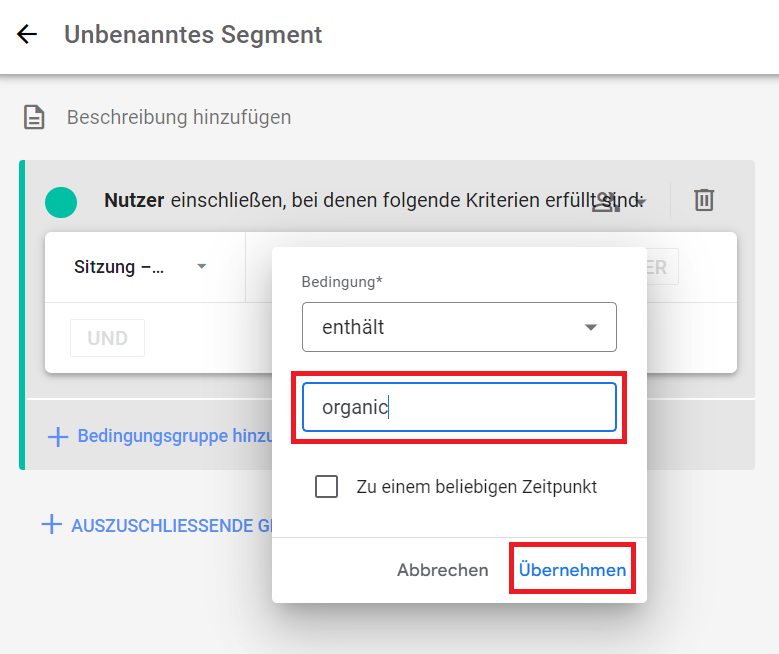
Abbildung: The Medium condition contains the parameter value organic for filtering organic traffic from Google search in data explorations in Google Analytics 4 (GA4).
Segmentnamen festlegen
Gebt eurem Segment einen passenden Namen. Bei organischem Traffic zum Beispiel: Organische Zugriffe. Klickt anschließend auf Speichern und anwenden.
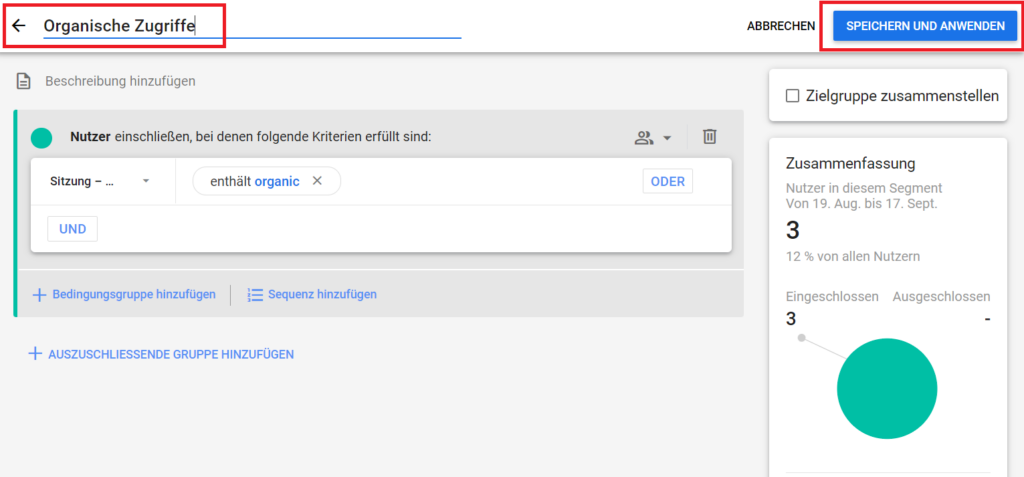
Abbildung: Set your segment name, for example: Organic Traffic or Paid Traffic in data explorations in Google Analytics 4 (GA4).
Done - now you can see the segment comparison in your exploratory table:
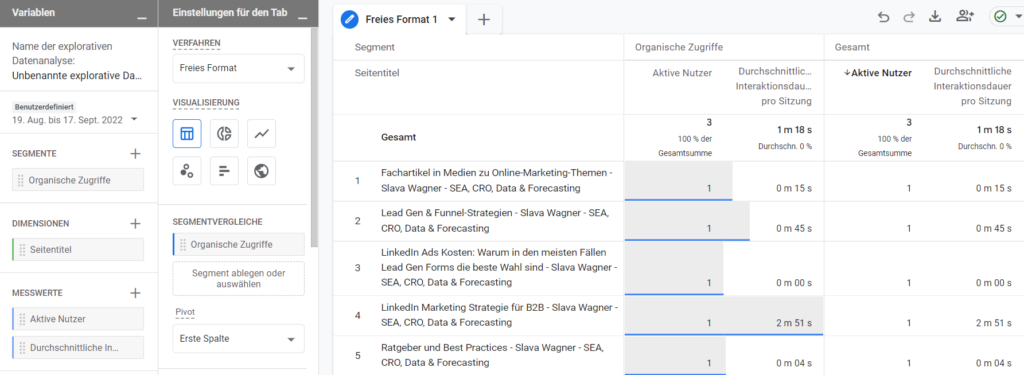
Ready-made, exploratory data analysis with self-configured dimension, metric and segments in data explorations in Google Analytics 4 (GA4).
Toggle visualizations
Last but not least, there is a toggle button in the top left of the menu for the different visualization forms. If you click on the line chart, you will automatically get a line with a time axis and exciting reports in the chart line points about possible anomalies.
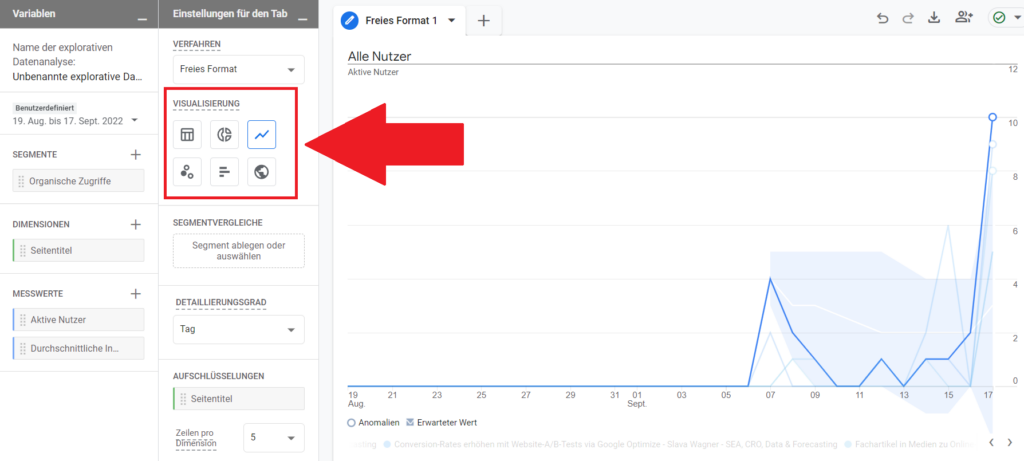
The visualization is also possible as a pie chart or line chart with a time axis. Scatter plots can also be used in data explorations in Google Analytics 4 (GA4).
Add report name
Now you can give the report a name. Reports are always saved automatically and you can access them at any time at:
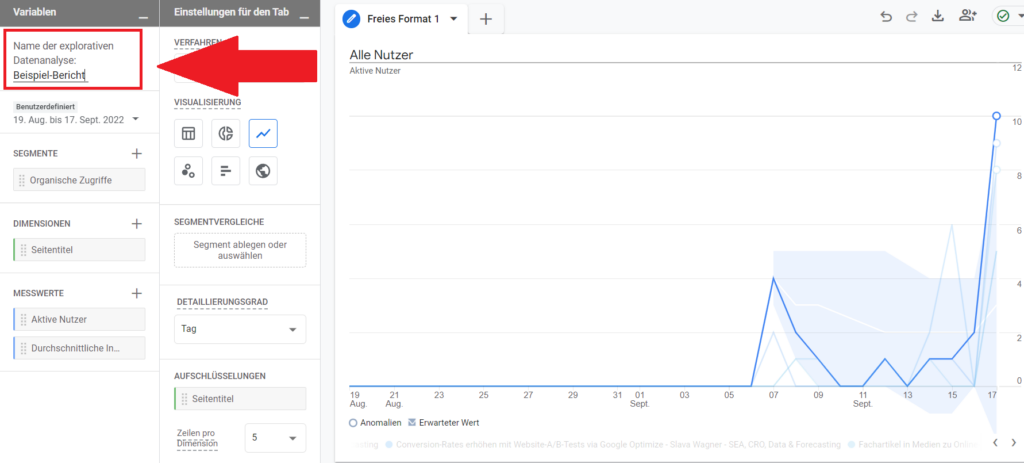
Name your report and you are ready.
Data explorations with Google Analytics 4 (GA)
If you have any questions about exploratory data analysis with Google Analytics 4 (GA4), feel free to ask:
Ask your question
info@slavawagner.de
Overview
Data analysis in Google Analytics 4
With exploratory data analysis in Google Analytics 4 (GA4), you can do the following:
- Combine all dimensions , metrics and custom segments from Google Analytics 4 (GA4) and drill down into data.
- Automatically visualize data in: tables, line charts, scatter charts, maps, bar charts, and pie charts.
- Track active users who have visited your thank you pages or checkout pages. These are tracked across devices and sessions.
Ask your question
info@slavawagner.de
Overview: Exploratory data analysis with Google Analytics 4
Exploratory data analysis with Google Analytics 4 is a reporting application to make extensive use of the data collected with Google Analytics 4. You can use it to determine the conversion rate of landing pages, identify a need for optimization, and measure the return from individual traffic sources on your website.
The results of the exploratory data analysis can therefore be used to improve the performance of digital platforms and to optimize the user experience. On this basis, you can make data-based decisions and develop online marketing strategies. Overall, exploratory data analysis with Google Analytics 4 offers discovering numerous patterns, trends and connections in your website data and using them to draw important conclusions in your online marketing.
FAQ - Summary of exploratory data analysis with Google Analytics 4 (GA4)
Here you will find a summary of important and frequently asked questions about exploratory data analysis with Google Analytics 4 (GA4):
By default, Google Analytics 4 (GA4) no longer records users as in Google Analytics 3 with a client ID that tracks website users based on browser cookies, but with a user ID that tracks website users across devices and browsers tracks. This makes it possible to get much more comprehensive data about website usage behavior and to better understand the customer journey of your customers.
Google Analytics 4 (GA4) Exploratory Data Analysis is a report editor that allows you to mine your website data to accurately analyze the behavior of your website users. In the exploratory data analysis of Google Analytics 4 (GA4) you can use all dimensions and metrics of the system and put together different combinations to get the most in-depth analysis options.
Open the Google Analytics 4 (GA4) dashboard and click on the menu item “Exploratory data analysis” in the left menu bar. Then either select one of the preconfigured reports in the main window or create your own report in the “Free format” selection window. This allows you to combine all imaginable dimensions and metrics for your website data.
Segments in Google Analytics 4 (GA4) exploratory data analysis lets you analyze user traffic on your website by traffic sources (acquisition sources) or add custom event, user, or session segments.
You might also be interested in:
Track phone number redirects from Google Ads campaigns
With Google Tag Manager you can install phone number forwarding for Google Ads campaigns on your website.
Create reports with Data Exploration in Google Analytics 4
Many report views that were preconfigured in Google Analytics 3 must be manually created in Google Analytics 4.