Visualizer: Tables and Charts Manager for WordPress - interactive website charts with data bridges
With the WordPress plugin Visualizer: Tables and Charts Manager for WordPress you can connect auto-updating charts from Google Sheets to your website. They are also interactive, contain tooltips and can be animated.
If you want your chart data to update automatically on the website, the WordPress plugin Visualizer: Tables and Charts Manager for WordPress is probably for you, as it can display data from auto-updating Google Sheets tables in real-time in in an embedded website diagram.
The free basic version is sufficient for the most important use cases, but only has the function for manual synchronization of Google Sheets data. If you don’t mind syncing the charts from time to time with a click of the import button, then the Basic version is ideal for you. However, if you want a real-time, hourly or daily import, only the Pro version of Visualizer can do that.
Which dates are suitable for auto-refresh with Google Sheets?
Google Sheets is so popular because a significant majority of all common online marketing applications can be connected. This can be done either directly with an API interface or with a connection via the leading data connector application Zapier . For example, you can set up demand and trend monitoring for a blog article by displaying keyword search volume data – from the Google Ads Keyword Planner or product search volume data from Helium 10 for Amazon.
For example, you can import data for a certain keyword search volume from Google’s Keyword Planner into Google Sheets in an auto-refreshing manner (this can be done via the add-on in Google Workspace or via the Mixed Analytics API connector ). Then create a second table in which you pre-format the data with the import range function in Google Sheets for Visualizer ready for use. You can then plug this spreadsheet into Visualizer using the Google Sheets spreadsheet online share link. You can also add a forecast to an existing, tabular data set over time by adding the data for it.
Instructions: Create a diagram with the WordPress plugin Visualizer
Step 1 - How to format Google Sheets spreadsheets for the WordPress Visualizer plugin
The WordPress plugin Visualizer can only integrate data into the chart if it is in a predefined format. This works as follows:
- The table header contains the names of the dimensions (e.g. timelines or labels) and metrics (values) of the chart
- The second line shows the data format and must always be formatted as plain text . There are two data formats, one of which you must store in each column: string and number . String must exist for each dimension of the chart (e.g. for a time axis: date, days, years, months, hours, etc.). Number must be present for each metric (for example: search volume per month, clicks, impressions, cost, conversions, deals, cost per deal, percentage)
- All other rows contain the data that will later be displayed in the diagram.

When formatting your Google Sheets for Visualizer, make sure to enter string for dimensions and number for metrics in the second row.
Step 2 - Share Google Sheets spreadsheet for WordPress plugin Visualizer online as comma delimited CSV file
The WordPress plugin Visualizer then needs online access to the Google Sheets table for the diagram visualizations. The table must be released as a comma-separated CSV file. To do this, click File at the top of your Google Sheets spreadsheet > then Share > publish to web > then select Comma Separated Values (CSV) from the drop-down menu. Done – now the spreadsheet is ready for online access. Now copy the sharing link.
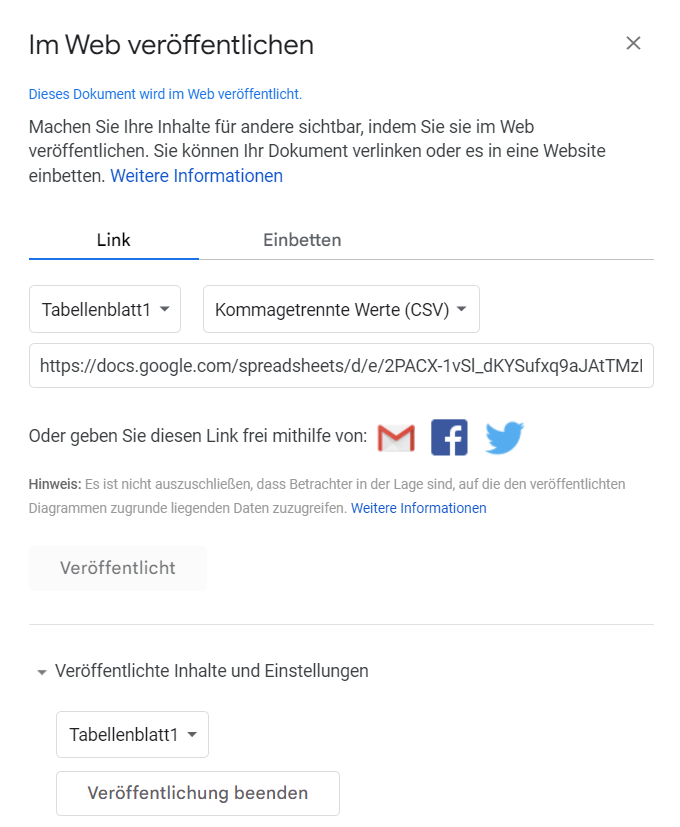
Share your Google Sheets spreadsheet to the web as a comma-delimited CSV file.
Step 3 - Connect the Google Sheets table to the WordPress plugin Visualizer
Now go to your WordPress dashboard, select the WordPress plugin Visualizer in the left menu bar and create a chart (e.g. a line chart). There you can directly in the first tab (Source). Open the item Import data from URL and paste your copied sharing link. Then click on the import button. Done: Your chart data has now been imported.
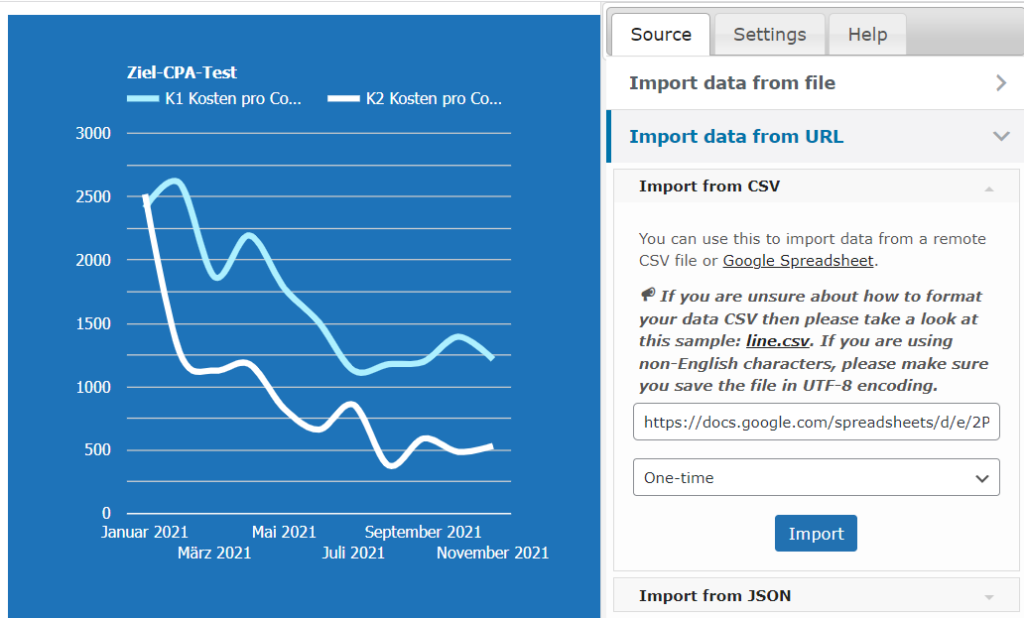
Enter your Google Sheets spreadsheet share link into the WordPress plugin Visualizer and import the data set.
Step 4 - Decide on the design for the visualizer chart
In the second Settings tab you can now specify the design and various other settings. Make sure that the lazy load option is disabled, otherwise the loading time will be too long. You can also create a clean image dump of the diagram as a PNG with a transparent background. This is useful if you prefer to use an image on the website instead of the interactive chart to maximize loading time. To do this, check the Save chart as an image inside Media Library option . You will then find a PNG for your diagram in the WordPress media library. Now your chart is ready and you can use it.
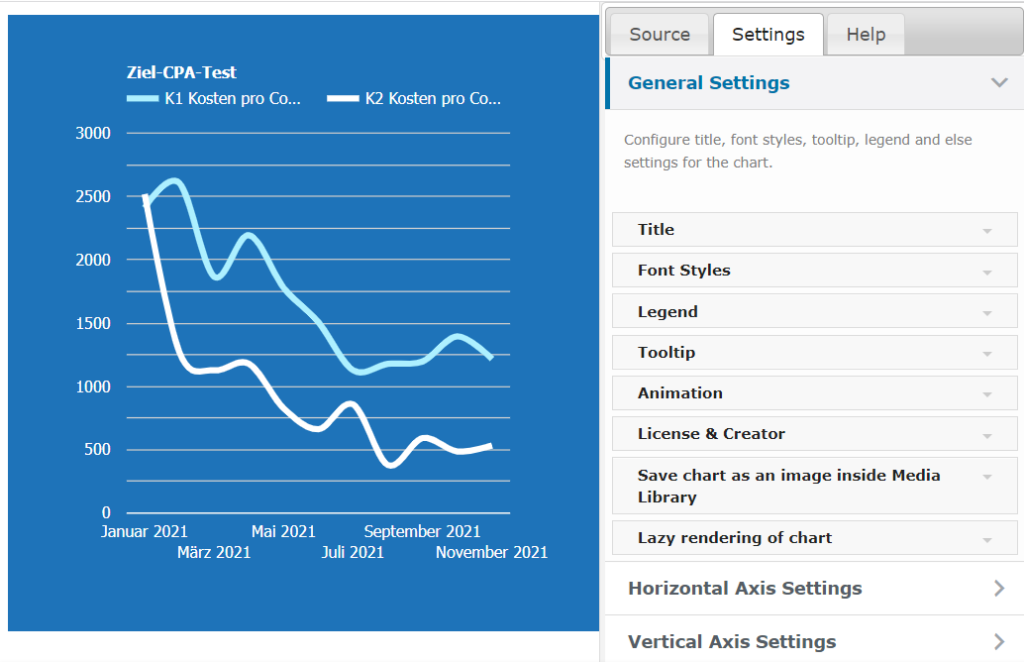
Edit the design of your visualizer chart in the settings (General Settings).
Visualizer: Tables and Charts Manager
If you have problems with creating data bridges with the WordPress plugin Visualizer: Tables and Charts Manager for WordPress , or the loading time of the animated diagrams is too high, feel free to ask:
Ask your question
info@slavawagner.de
Overview
- Which dates are suitable for auto-refresh with Google Sheets?
- Instructions: Create a diagram with the WordPress plugin Visualizer
- Step 1 - How to format Google Sheets for Visualizer
- Step 2 - Share Google Sheets spreadsheet online as a comma delimited CSV file
- Step 3 - Connect Google Sheets spreadsheet to Visualizer
- Step 4 - Decide on the design for the visualizer chart
What are the advantages of an auto-refreshing data bridge with charts in WordPress?
With the WordPress plugin Visualizer: Tables and Charts Manager you can create a data bridge from a Google Sheets document in a WordPress chart.
For example, you can use an API connector from Mixed Analytics to import search volume data for keywords from Google Ads into a Google Sheets document in an auto-updating manner, and from there display it as a chart on your WordPress website.
In this way, you can display exciting trend barometers for various industry keywords in your content pages in order to map demand developments.
Ask your question
info@slavawagner.de
You might also be interested in:
Track phone number redirects from Google Ads campaigns
With Google Tag Manager you can install phone number forwarding for Google Ads campaigns on your website.
Create reports with Data Exploration in Google Analytics 4
Many report views that were preconfigured in Google Analytics 3 must be manually created in Google Analytics 4.