Why do we need to validate forecast?
The validation of the inventory data involves the determination of a reliable calculation model. A past forecast provides us with the data for this: Validated seasonality data.
Calculate seasonality
In the standard case, we can never derive a uniform calculation model from the entire bandwidth of a data set, which would be the cause for the recurrence of certain patterns.
In order to determine such a calculation model, a realistic seasonality must be calculated for a realistic forecast. Seasonality is a necessary input for regression analysis from a dataset, and describes the period of data collection in points. For example, if the dataset lists 1,000 consecutive days of organic website clicks from Google Search, that would be 1,000 data points. A seasonality could now be set to a specific value to be taken into account. Data points could be measured in terms of years, quarters, thirds, months, weeks, days, hours, minutes and seconds – what matters is that the metric and spacing between entries is the same.
If we want to forecast the development for 6 – 12 months, the seasonality would also have to be measured at 6 – 12 months. In the case of days as data points, this would correspond to 182.5 to 365 points in seasonality. As a best practice, we recommend starting with a seasonality of 200 points for organic website clicks.
Forecast based on historical data in the poast
To determine the causal pattern for existing developments, we determine the seasonality with a past forecast. For this purpose, a forecast is calculated for a previous period. We can use the data from last year to calculate a forecast for a past half-year of the current year.
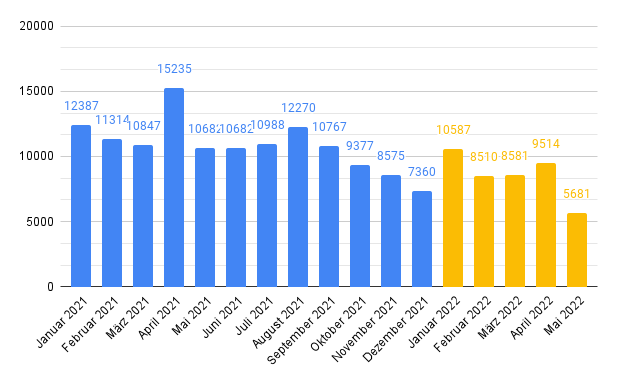
Left blue bars: example inventory data for website clicks from organic Google search. On the right in yellow bars: forecast values from inventory data.
Real development in the same time period
This data from the past forecast is then compared with the real development.
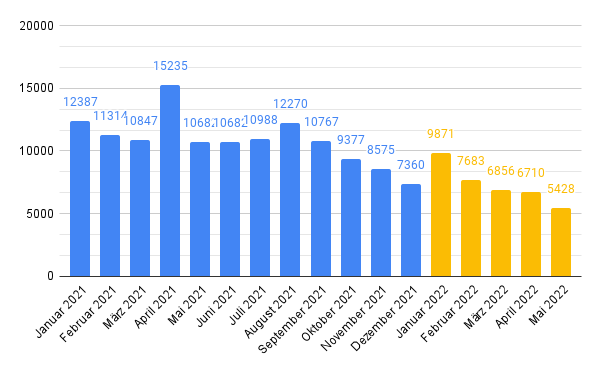
Left blue bars: Example inventory data for website clicks from organic Google search. On the right in yellow bars: Real development of the inventory data.
Check trend development
When comparing past forecasts with real developments, what matters is whether trends broadly match. If there are larger deviations, other seasonality values should be tested for the calculation of the forecast model. Only when we have a seasonality value for a suitable trend development do we know how a recurring pattern can be calculated for a realistic forecast. This value must then be used for the correct forecast.
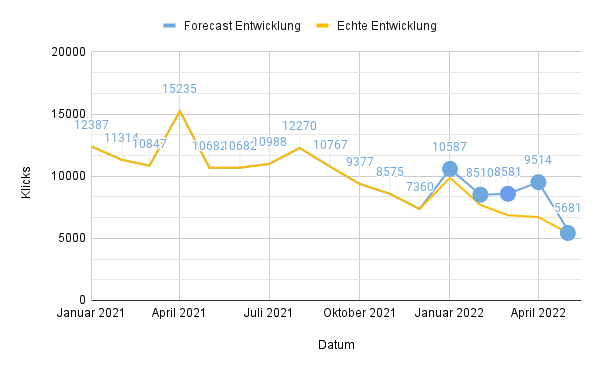
Comparison between real inventory data and forecast values. The decisive factor here is whether the development of the trend is, by and large, realistic.

Slava Wagner
Marketing & Leadgenerierung
SEA, Paid Media, Conversion-Rate-Optimierung, Markt- und Trendanalysen im Raum Berlin-Brandenburg.
Telefon: +49 176 588 744 04
E-Mail: info@slavawagner.de