Improve scroll depths with website A/B testing via Google Optimize

In addition to increasing the conversion rate and reducing the bounce rate, we can do other exciting website A/B tests with Google Optimize. For example, tests to determine a particularly binding website version that encourages users to read the landing page to the end if possible.
Landing pages, which are primarily designed for lead generation, often have a tried and tested standard structure: They start with an exciting head area, appealing headlines, then move on to an information area in the middle and end with a contact form that the website user can use can register for an offer and thus enter a funnel.
The goal of such conversion landing pages is always to maximize the conversion rate. That means: What percentage of a hundred users become leads and make use of our offer? This article explains how a conversion rate can be increased directly in a contact form or on an order page with A/B tests. In order for users to remain on the website at all, instead of jumping off 90% of the time, this article says.
Now, these two articles will focus on the first and last parts of scrolling in a landing page layout. In between, a structure section is missing, namely the middle part – the content block – through which users have to scroll to get to the contact form. To do this, we can use a scroll depth test to find out which content most strongly encourages users to continue reading, instead of leaving the landing page halfway when scrolling.
How relevant is an improved scroll depth for the conversion rate?
An increased scroll depth ensures that more users consume the content at all. Where users do not consume the content and leave the landing page, they accordingly cannot even get to fill out or even see a contact form.
With a general bounce rate of 90% and a low average scroll depth, where only 20% of the remaining 10% as a subset make it to the contact form, the calculation would be: 100 users arrive at the landing page, for example via Google Ads with one CPC (Cost-per-Click) of, for example, 2 euros – that would be an advertising budget of 200 euros. With a 90% bounce rate, only 10% remain, meaning that out of those 100 users, effectively only 10 users stay on the site at all.
The cost point for a user who consumes the content at all would therefore be 20 euros per user at this level. But it goes even further: With regard to scroll depths, only 20 percent of this subset comes down to the lowest section – the contact form. That would be 2 users out of 100 who make it to the bottom.
In the end, in this realistic example, only 2 out of 100 users see the contact form and even consider sending it.
Users need to consume the content before the contact form to understand what this offer is about and to be convinced to submit the request at the bottom of the landing page.
Store scroll depths in Google Analytics 3 and Google Analytics 4 as a metric
Since Google Optimize works with Google Analytics in the measurement, a scroll depth measurement must first be recorded there. In Google Analytics 3 and Google Analytics 4, percentage sections for scroll depths must be stored in Google Tag Manager as an event with the Scroll Depth trigger and output as an event to Google Analytics 3 with a Google Analytics: Universal Analytics tag. When configuring the trigger scroll depth (Scroll Depth), you can optionally specify a division of the landing page scroll depth in percentage sections: We recommend division in 25 percent increments or in 10 percent increments.
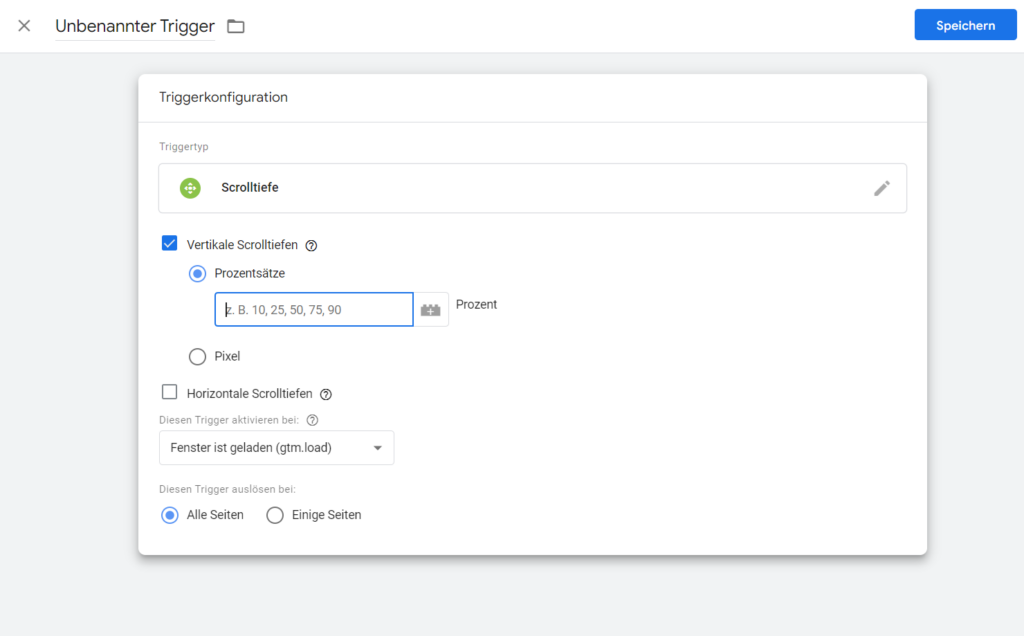
Implementation of scroll depths as a trigger for a Google Analytics event in Google Tag Manager.
However, Google Analytics has limited data processing capabilities when collecting events, so splitting into 10 percent increments could quickly overwhelm the data collection in the account. Ergo: In the event report, instead of a green shield icon, there could be a yellow shield icon at the top, which indicates, for example, that the data is only available for 80% of the sessions and not for 100%, since the data volume of the event recording is the volume of a free Google -Analytics account blows up.
Therefore, for accurate and safe data collection, the 25 percent increments would make more sense when we are dealing with very high traffic sites, because each scroll that shows up as a counter in the percentage section counts as an event. With 10 percent increments, we would have 10 events or more per user – if they scroll up and down. With 25 percent increments, that would be 4 events per user – or more or less.
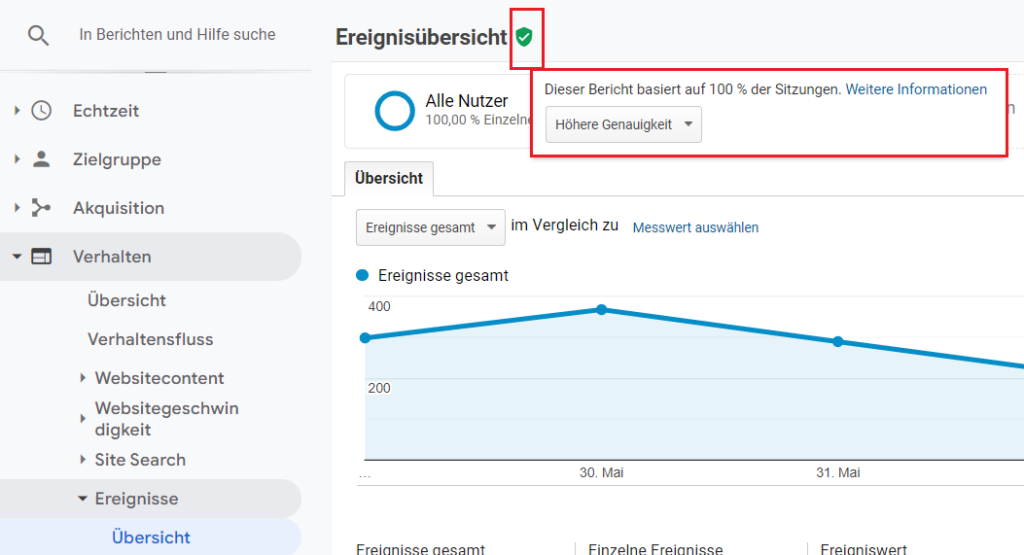
Figure: If the event counting capacity is overloaded, the normal version of Google Analytics 3 can show that the data given is no longer based on 100% of the sessions, but on a smaller proportion. This can be the case when so many events flow into the system through the scroll depth measurement in the form of 5 percent or 10 percent increments per user and session that it automatically stops counting many events.
Set scroll depth as a target metric for measurement in Google Optimize
As soon as the scroll depth is output as an event to Google Analytics 3 or Google Analytics 4, we can select this in Google Optimize as the target metric of the A/B test.
What do website A/B tests tell us about scroll depths?
We use scroll depth tests to see the percentage of users who reach a specific section of the landing page. Most people’s website user behavior is extremely fast-paced, and we can always assume that the percentage of lingering users will decrease with each landing page section level. Let’s assume a division into 25 percent increments: In this case, the first 25 percent is the top container and the last 25 percent is the bottom. As a rule, far less than half of the users will reach the bottom container. What interests us are the middle two levels, because they indicate how the middle blocks of content affected exit behavior.
Now let’s move on to the testing strategies.
Test 1 - Content Blocks: Information Hierarchy
What interests users first? Is it worth getting straight to the point, or is it more of a substantive introduction than a bridge? We can only estimate this in advance based on experience as a guideline. In practice, we can only determine which content block extrapolated to 1,000 but really arouses the most interest to continue reading with an A/B website test. With Google Optimize, content blocks can be moved and arranged in the front-end editor using drag-and-drop.
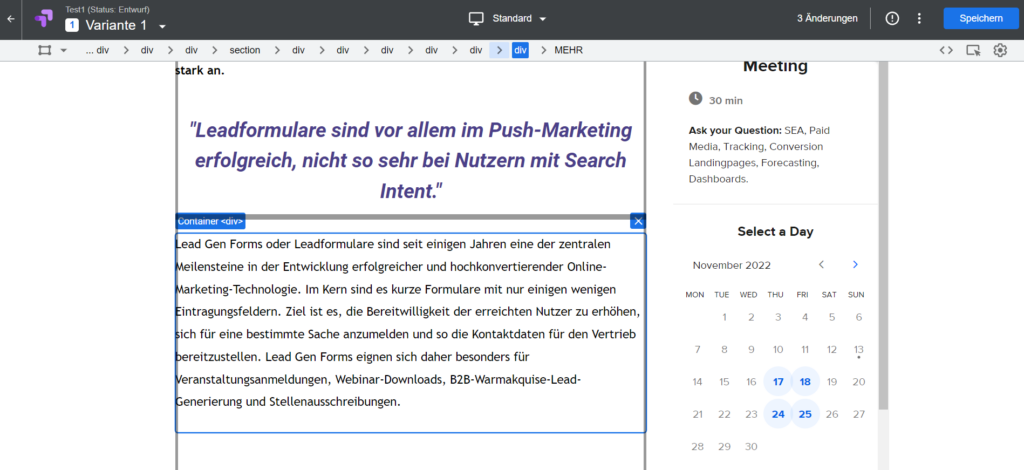
Drag the container to the right places in Google Optimize’s drag-and-drop editor to test different hierarchies of information for scroll depths.
Test 2 - Content blocks: Content and visual information design
The content and visual information design is once again about testing headings, images, texts and buttons. The tests should always be run one after the other, i.e.: only start a new test when the previous one has ended in order not to mix up the results. Here it says again, as in the instructions for reducing the bounce rate and increasing the conversion rate: test the sizes, content and arrangement of the individual content blocks.
Headlines:
- Test the size of the headings
- Test the color, font, and style of the headings
- Test headline content: Try persuasive approaches, perhaps with the help of copywriters or best practices from professional copywriters
Test images:
- Test image sizes
- Test image content
Test texts:
- Test text content
- Test text element highlighting: Print important passages in bold or as a quote in colour, larger and highlighted
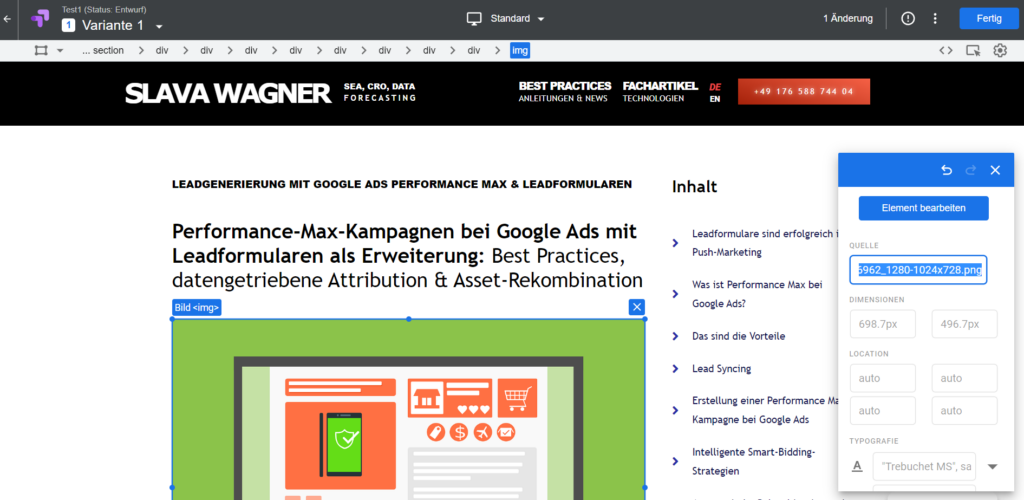
You can test images by clicking on the image and storing a different image URL in the toolbox. Accordingly, the new image you want to test should already be uploaded to your website in advance so that you can set the website A/B test link.
Test 3 - Equip content blocks with navigation elements: tables of contents
Sometimes the overall scroll depth can be increased to 1,000 by implementing a table of contents. This may not sound that spectacular, but it is actually the classic in scroll depth improvement. It seems important for many users to have at least a rough idea of the length and content of the landing page.
Such a table of contents can be a conservative-looking list at the beginning of a text, a small, smart list on the left or right sidebar or a small box that moves with you when you scroll – on the side or in the header bar. Ultimately, the motto here is again: test, test, test.
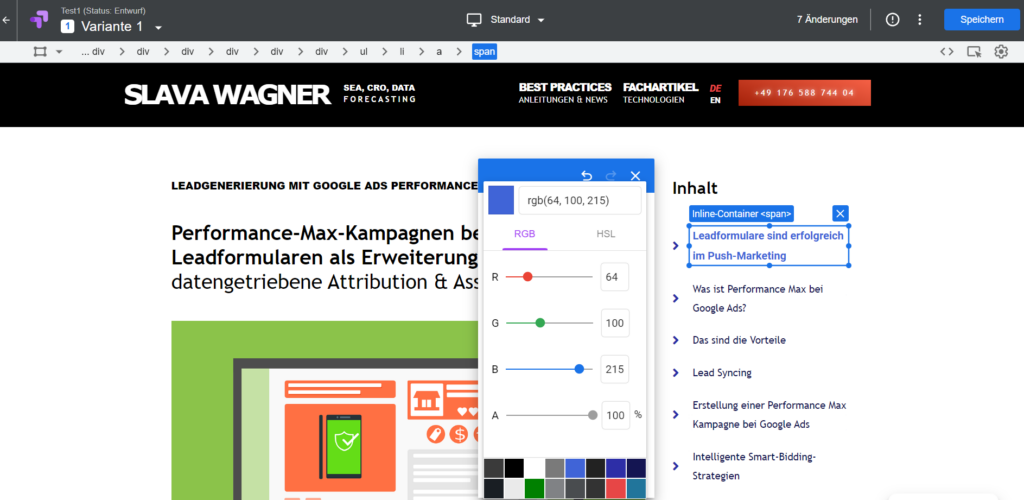
You can also include tables of contents for a test and try different design variations. At the end of the website A/B tests, you can see which version brought the highest scroll depths.
Overview
- How relevant is an improved scroll depth for the conversion rate?
- Store scroll depths in Google Analytics 3 and Google Analytics 4 as a metric
- Set scroll depth as a target metric for measurement in Google Optimize
- What do website A/B tests tell us about scroll depths?
- Test 1 - Content Blocks: Information Hierarchy
- Test 2 - Content blocks: Content and visual information design
- Test 3 - Equip content blocks with navigation elements: tables of contents
Summary: Improve scroll depths with UX through Google Optimize
With a scroll depth in Google Analytics 4 (GA4) you can measure the user satisfaction of your content pages and landing pages. When you see that the absolute majority of your website visitors don’t scroll any further in the head area, you know that hardly anyone reads your content. To improve scroll depth, you can customize the UX design with website A/B testing via Google Optimize.
One way is to use visually appealing and engaging content that motivates users to keep scrolling the page. This can be achieved through the use of images, videos, infographics, and other visual elements that grab users’ attention and entice them to keep scrolling the page.
Another option is to change the information hierarchy of your website so that website users are guided through the content more stringently. A third possibility is to optimize the page structure and navigation to motivate users to keep scrolling the page. This can be achieved through the use of clear headings, subheadings and the incorporation of table of contents with jump labels.
FAQ - Improve scroll depth summary with UX by Google Optimize
Here is a summary of important and frequently asked questions about improving scroll depths with UX through Google Optimize:
A scroll depth in Google Analytics 4 (GA4) indicates how many users scrolled to specific sections of your landing page. This allows you to see whether users stop scrolling at a certain point and thus stop reading. You can then tweak this area to increase dwell time on your landing page and encourage users to scroll down to the contact form after reading the content.
Scroll depths in Google Analytics 4 (GA4) can be tracked with the Google Tag Manager. There you can store percentage scroll depth sections either in percentages – 5%, 10%, 20% or 25%. In the background, your website is divided vertically into these percentages. After you have created an event in Google Tag Manager and transferred it to Google Analytics 4 (GA4), you can see how many users were in each section for each of your pages.
A scroll depth in Google Analytics 4 (GA4) shows you optimization potential. You will find out at what scroll depth most users stop reading your content. You can improve this accordingly, because the higher the scroll depth, the longer the dwell time. With conversion landing pages, where the contact form appears at the bottom, it is all the more important to guide users to the bottom of the page through clever UX design.
With website A/B testing via Google Optimize, you can improve user scroll depths on your website by testing information hierarchies or trying out the integration of a table of contents with jump labels.
You might also be interested in:
Reduce bounces with website A/B testing via Google Optimize
What improvements need to be made to the website to reduce the bounce rate?
Increase conversion rates with website A/B testing via Google Optimize
If we want to find out which website version gives the best conversion rate, we can do that with an A/B test.

