Reduce bounce rate with website A/B testing via Google Optimize: Test these elements to reduce bounces

What improvements need to be made to the website to reduce the bounce rate? The more visitors bounce on landing pages, the less content is consumed and the fewer users convert. There are A/B test strategies for this, with which you are sure to get a good result.
If a website is getting a lot of traffic but the bounce rate is over 90%, most users will get nowhere and will not even engage with the website content. There is a common reflex: Then we don’t want the users who jump off. Another common objection: maybe bounce rate doesn’t correlate with conversion rate at all.
The fact is that we are dealing with this on a purely technical level: The more users consume the content at all, the higher the probability of a conversion, i.e. triggering a target action. Such a target action could be filling out a contact form. A reduced bounce rate is a necessary condition for the increased triggering of the conversion. Ergo: The more users stay on the website instead of jumping off immediately, the higher the probability of a conversion. A conversion cannot be triggered if the user bounces before seeing the contact form.
Conversely, this means that it makes sense, especially for target pages with a lot of traffic, to design them structurally in such a way that users are bound and do not jump off immediately. To measure this, there are two metrics:
What is Google Analytics 3 bounce rate?
In the old Google Analytics, which is scheduled to be phased out in mid-2023, the metric for this is the bounce rate. It indicates the percentage of users who take no further action on the site. That means the lower the bounce rate, the better. A bounce rate of under 60% can be perfectly fine, but one over 90% still needs improvement.
What is engagement rate from Google Analytics 4 (GA4)?
In the successor to Google Analytics 3, i.e. Google Analytics 4, the core metric for measuring bounce behavior is the so-called engagement rate. In turn, this indicates the percentage of users who carry out further interactions on the website. That means the higher the engagement rate, the better. However, the bounce rate has now also been upgraded in Google Analytics 4.
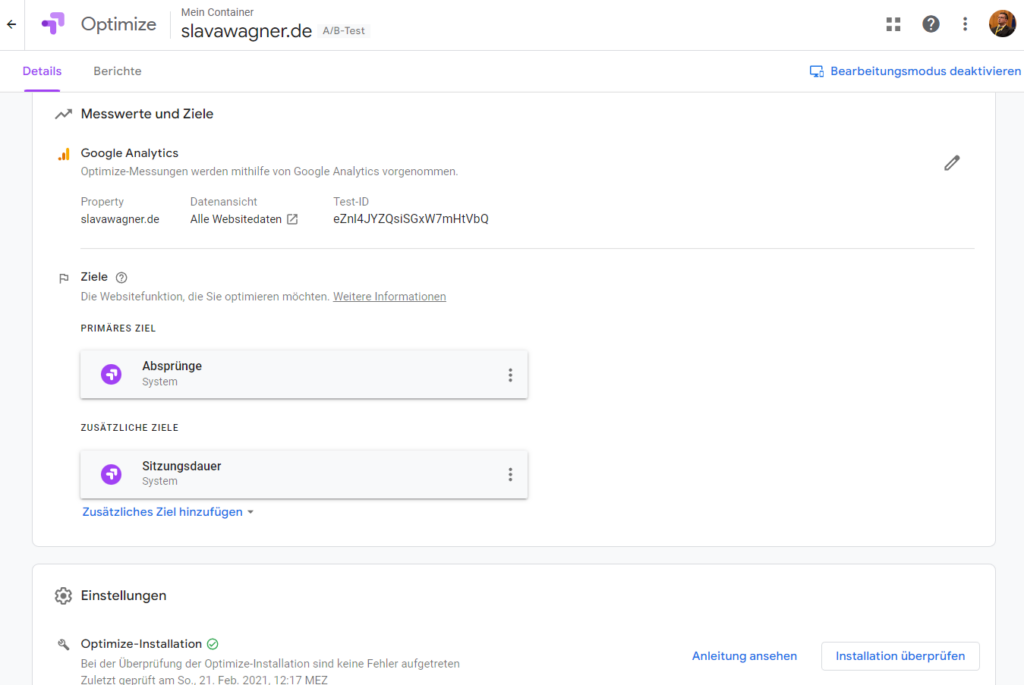
Here you can check your Google Optimize installation, establish the necessary connection with Google Analytics and configure your test goals. In this case: jumps. However, in Google Analytics you will also see various other metrics for your site trial variant and site original during the trial period.
Create a website A/B test in Google Optimize
To create a website A/B test, you can create a free account in Google Optimize and link it to Google Analytics. Test variants can then be created: website variants are delivered to users in equal proportions and tested for a specific target metric, in this case bounces or engagement. Each user always sees the same website version intended for him. Ergo: With a delivery of 50:50, half of the users always see the original website, while the other half only sees the cookie-based test version. Website variants can be created externally in a frontend editor once Google Optimize is installed on the website.
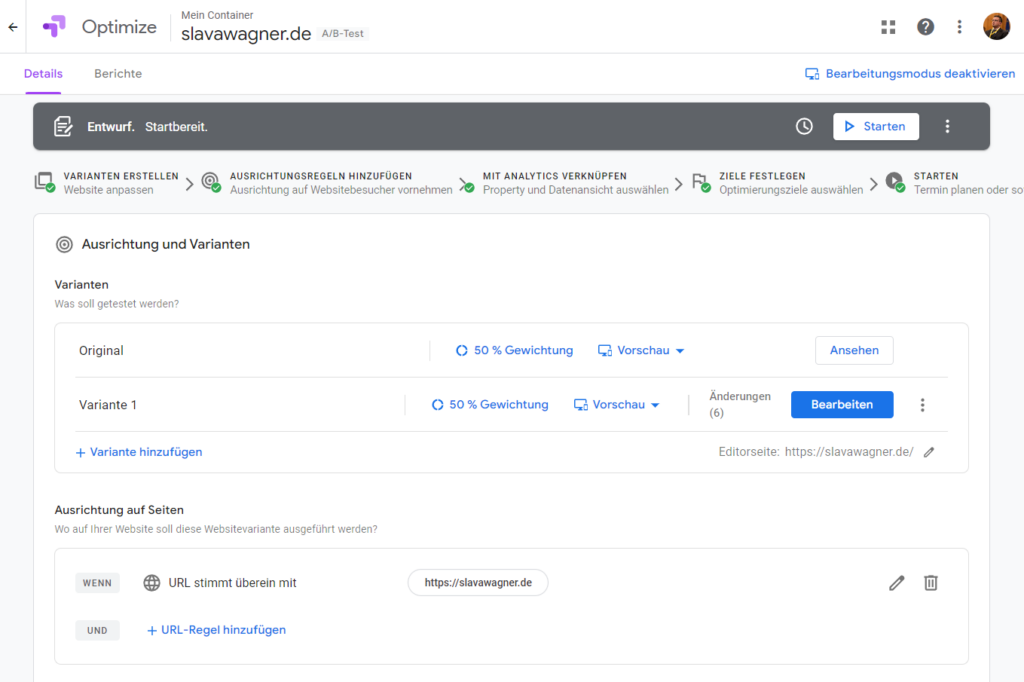
Set the targeting rules for your website A/B test. You can then add a new website variant for the test and edit from here.
Test strategies and factors for exit or stay
Now it’s a matter of changing elements on the website and testing them for the best version when delivered to the users. To do this, the bounce rate or engagement rate must be selected as the measurement target and a new website variant created. Then it’s time for the actual tests. Here are the most important elements:
We must not forget that online users are not determined researchers who consume content immediately and go through every last detail. In reality, the surfing behavior of most online users is more influenced by everyday situations – they decide within a few seconds whether the website meets their expectations or not. Various aspects play a role that users consciously or subconsciously like or dislike, such as the color scheme, choice of images, headline content and titles, and overall design.
Test 1: Test the size of the head area with Google Optimize
The head area is the first element a user sees and at the same time the most important element that decides whether to leave or stay. Often important content is not placed above the fold, requiring users to scroll down to see what the site is about. Therefore, different sizes for the head area should be tested.

If you want to test the size of the head catchment area, drag and drop the bottom point of the <div> container and the <section> container in the Google Optimize frontend editor.
Test 2: Test headline content with Google Optimize
Some will know the effect of good and sales-boosting copywriting. Depending on the product and offer, it makes sense to try different types of headlines, be it a question formulation, a benefit formulation or the communication of a specific function that the user might need. In the end, as always, only one thing helps: testing.

For headline content testing, you can simply click on the headline in Google Optimize’s drag-and-drop editor and select “ Edit Element ” in the toolbox to replace the text for the A/B test.
Test 3: Test the layout of headlines with Google Optimize
Heading design testing tests the sizes, colors, and positions of the headings. It is quite possible that more prominent headlines are better received by the target group. However, it can also be the case that smaller and finer headings with a smaller font style look quite classy and thus more closely match the expectations of the incoming visitor target group. The same applies to the coloring: signal colors can either arouse interest or appear too flashy and immediately cause a jump.

If you want to test a color or size for a heading, just click on the heading and select the color choice or size configuration box in the toolbar.
Conclusion: Initial website elements are crucial for bounce rates
As you may have already noticed, the three test strategies for bounce rate reduction mentioned are based on the start of a landing page, i.e. on the start screen that the website visitor sees. It is initial elements that decide whether to stay or bounce, which is why these are also the central parameters that we have to test in order to reduce bounces and thus get more users to interact with our content.
Overview
- What is Google Analytics 3 bounce rate?
- What is engagement rate from Google Analytics 4?
- Create a website A/B test in Google Optimize
- Test strategies and factors for exit or stay
- Test 1: Test the size of the head area with Google Optimize
- Test 2: Test headline content with Google Optimize
- Test 3: Test the layout of headlines with Google Optimize
- Conclusion: Initial website elements are crucial for bounce rates
Summary: Reduce bounces rates with Google Optimize via A/B-Tests
The bounce rate indicates the percentage of users who do not engage in any further interaction on the website. The lower the bounce rate, the higher the chance of a conversion, since more users consume your content in the first place. While this doesn’t necessarily have to lead to more conversions, it is a necessary but not sufficient condition: only if more people consume your content at all can you generate more conversions. You can measure a bounce rate with Google Analytics 4 (GA4), for example. But you can also improve the bounce rate with the free and high-performance A/B testing environment Google Optimize. With Google Optimize, businesses can run A/B tests to test different versions of their website and see which resonates best with their users.
In addition, Google Optimize also offers personalization features that companies can use to personalize and customize their website, for example based on campaigns, ad groups and keywords from Google Ads or UTM parameters from social media links. This can also help to reduce the bounce rate and increase the conversion rate, since with personalization you create greater congruence, i.e. congruence, between the click source and the click target.
To use Google Optimize, you can first create a Google Optimize account and install the Google Optimize browser extension on Google Chrome. You would then have to link your Google Analytics account to Google Optimize. Install the Google Optimize tracking code on your website and you can start your A/B tests for website variants.
FAQ - Summary of how to reduce bounce rates with website A/B tests via Google Optimize
Here is a summary of important and frequently asked questions about reducing bounce rates with Google Optimize:
A bounce rate in Google Analytics 4 (GA4) indicates the percentage of users on your website or landing page who took no further action.
You can improve your measured bounce rate in Google Analytics 4 (GA4) by using better UX design, more engaging headline speech, or different header image choices. It is best to use Google Optimize for an A/B test, which shows you data-based which test version of your website has a lower bounce rate among your website visitors.
Google Optimize is an A/B testing and personalization application that allows website owners to serve their websites and landing pages in different test variants to find out which version has the best bounce rate and conversion rates.
A website A/B test with Google Optimize is a method of comparing two or more website versions, in which two or more groups of users are served different versions. The performances of the test versions are then compared to determine the most successful version.
You might also be interested in:
Increase conversion rates with website A/B testing via Google Optimize
If we want to find out which website version gives the best conversion rate, we can do that with an A/B test.
Improve scroll depth with website A/B testing via Google Optimize
An increased scroll depth ensures that more landing page users actually read the content.