Predictive performance marketing is a method that allows you to monitor likely marketing developments 6-12 months in advance . The following framework will help you to find the right measurement concept, the right metric and the right technology.
What can you predict
Predict conversions
A combination forecast for conversions or leads from paid advertising enables a validated, modular prediction of conversion development between multiple acquisition channels (modules) in online marketing. The focus here is on the synergy effects between multiple acquisition channels: organic and paid development, conversion of new customers into returning customers and UX changes.wiederkehrende Kunden und UX-Veränderungen.
Predict user traffic
The forecast for user traffic shows us which thresholds and trends we can expect on individual acquisition channels. Suitable for organic search engine traffic, paid ads traffic and organic social media traffic.
Choose technology
Choose the regression analysis environment you want to use to create the forecast.
Select some metrics that you want to forecast
Forecasts can be compiled from any modules of metrics and channels – either individually or from all calculated synergy effects.
SEO forecast for organic search engine metrics
Data from Google Search Console, Bing Webmaster Tools, from Google Analytics with organic traffic segment, Matomo, Adobe Analytics.
- Prepare daily accesses as a data set
- Prepare organic conversions per day as a data set
Ads forecast for paid traffic metrics
Data from Google Ads, Microsoft Ads, LinkedIn Ads, Facebook & Instagram Ads.
- Prepare conversions and cost per conversion as a dataset by days, weeks, or month
- Prepare deals from paid search by days, weeks or months
Organic development social media forecast
Prepare data from social media portals as a data set: This can be platform-internal data or your own website metrics.
- Prepare impressions and clicks from articles as a data set by days, weeks or months
- Calculate traffic development on the website with conversion rate for traffic from social media
Forecast for customer lifecycles
Data from analytics and CRM systems.
- Google Analytics: How many new customers become returning customers (rate)
- Average lead to MQL and SQL conversion times
UX forecast for UX metrics
Forecast for the overall impact of UX optimizations on website usage behavior. Useful for users who do a lot of A/B website testing, for example with Google Optimize.
- Improved conversion rates
- Improved bounce rates or interaction rates
- Improved scroll depths
Validation
Historical forecast for previous data
A historical forecast – i.e. the examination of existing developments based on previous data – allows the validity of the calculation model to be reliably validated. During validation, a reliable seasonality value is determined in order to be able to create a realistic forecast.
Use validated seasonality value and finalize forecast
As soon as a seasonality value has been determined, which in the past forecast provided realistic trend developments in comparison with the real development, this must now be included in the real forecast.
Interpretation of the data
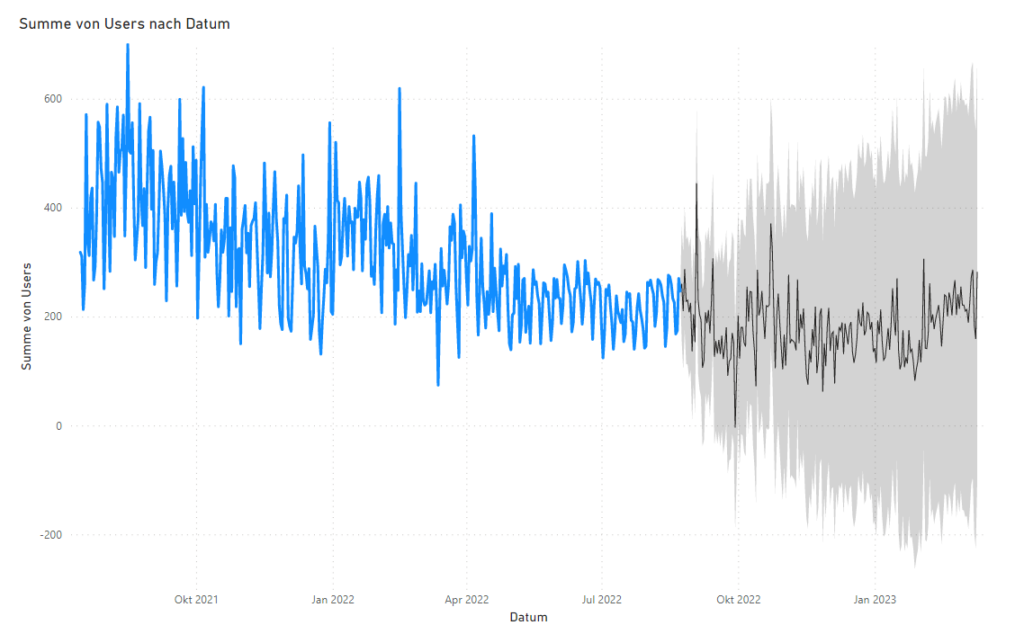
The further a forecast goes, the less realistic it becomes. A model based on a regression analysis can therefore only partially predict certain realistic patterns and of course cannot predict reality itself.
Forecast period: It is most reliable to forecast a development up to 6 months in advance – with less realism up to 12 months. A forecast period of about 120 points (days as data entries) is a good place to start. From there you can do custom testing.
Seasonality: A seasonality of 200 points (days as data entries) is a good start. From there you can do custom testing.
Interpret forecast data
Done: Now we can draw conclusions from our forecast. This applies above all to reaching certain threshold values after a certain month. If, according to the forecast, a value is permanently undercut from a point in time, there could be a need for action here.
From this we can also set up a manual monitoring system with alerts in a team . If monthly forecasts are made for selected performances and, for example, the organic development of website clicks from Google search threatens to fall below a threshold value, a standardized e-mail with a recommendation for action can be sent directly.
Expand uptrends
Recognize upward trends and strategic considerations about a possible extension of the lead.

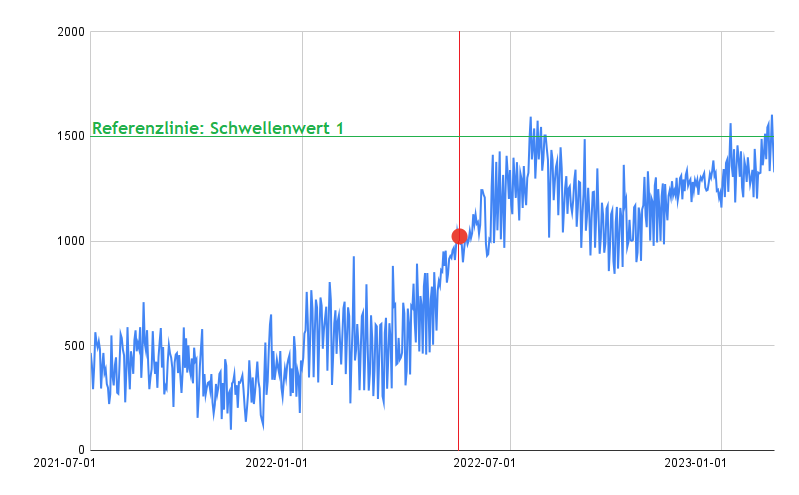
The predicted values are to the right of the red dividing line and show the potential opportunities for an extension of the upward trend using the example of organic traffic on the website.
Prevent downtrends
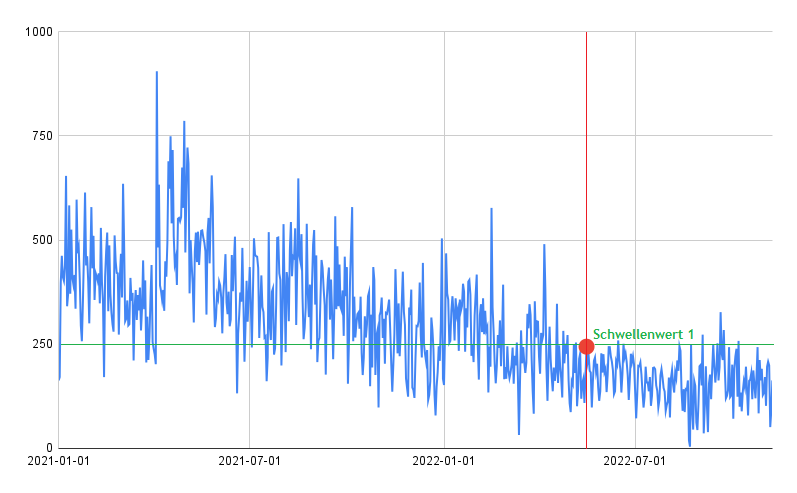
We can preemptively anticipate downward trends before they occur and set up a monitoring system with an alert function that gives us early warning for our acquisition channels and gives recommendations for action.

It is possible to anticipate downtrends before they occur. A manual monitoring system with a team that takes over the warning function helps to warn our acquisition channels at an early stage if certain threshold values are drastically undershot in 6 – 12 months.
Plan KPI target achievement
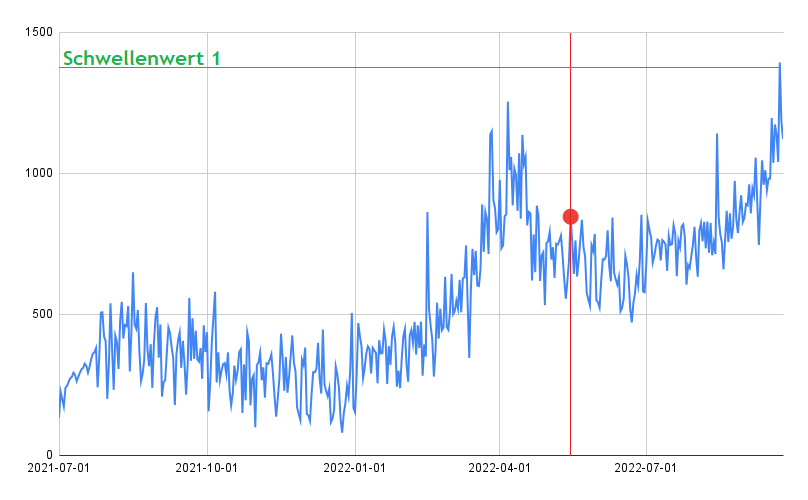
We can estimate how long it will take to reach a certain threshold with an online marketing campaign. This is particularly important if we want to know whether a target of, for example, 10,000 organic hits per month can be achieved with our strategy in 6 months, or whether it will only pick up in 3 years under the given circumstances. In such a case we would have to recalibrate.

The forecast values are to the right of the red dividing line. In this example, if we aim for a certain threshold, we can estimate how long it would take to reach this goal or at least approach it.
Scenario simulation
In addition to the forecast data, exciting scenario simulations for KPI target achievement can also be carried out: Which advertising budget could be used under which conditions, and what team strength would be required to create organic SEO content in order to achieve a certain range.
Marketing & Leadgenerierung
SEA, Paid Media, Conversion-Rate-Optimierung, Markt- und Trendanalysen im Raum Berlin-Brandenburg.
Telefon: +49 176 588 744 04
E-Mail: info@slavawagner.de


